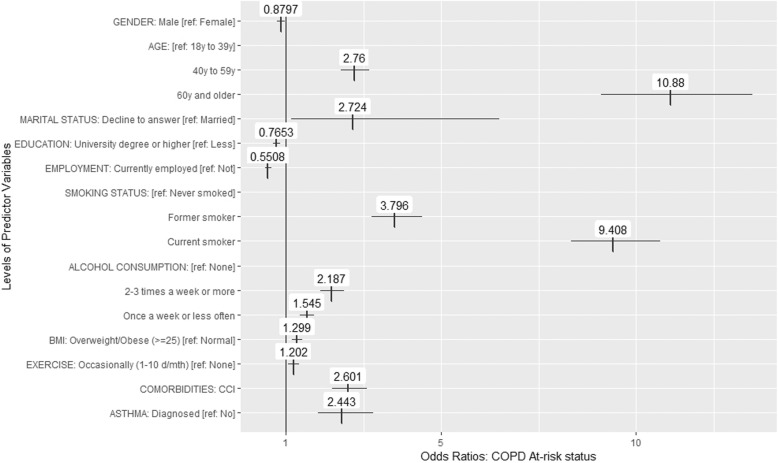
Fig. 1.
Logistic regression showing odds of being part of the ‘COPD Risk (undiagnosed)’ group (vs. Control group) as a function of predictors, adjusting for covariates. All predictors shown in the graphic reached statistical significance at p < 0.05. Tested predictors that did not reach significance include: Not married [ref. Married/living with partner]; Education level Decline to answer [ref. Less than university degree]; Monthly household income after deducting employer welfare benefits: All levels [ref. CNY 7999 or less]; BMI Underweight [ref. BMI Normal]; BMI Decline to answer [ref. BMI Normal]; Frequent exercise (11+ days/month) [ref. No exercise]

