
Fig. 3.
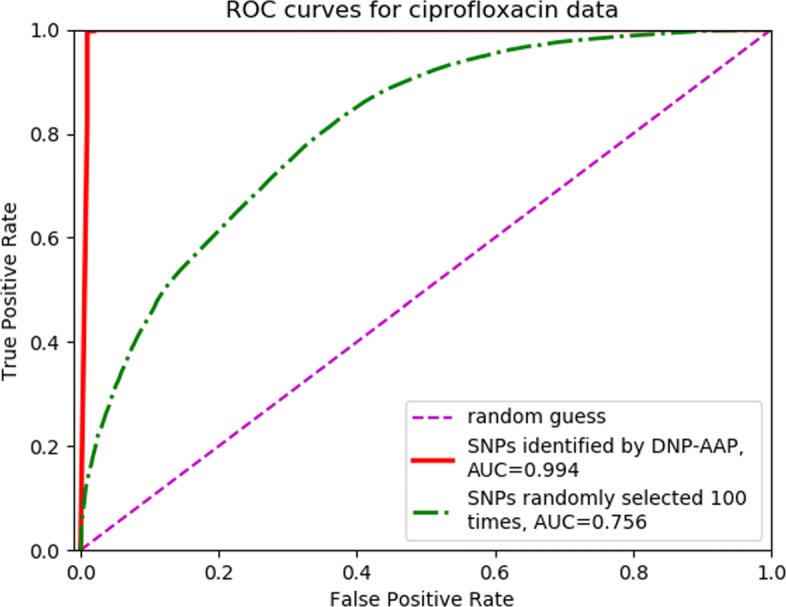
Classification performance of SNPs identified by DNP-AAP versus randomly selected SNPs. Shown are ROC curves for classifications made with SNPs identified by DNP-AAP and with randomly selected SNPs for ciprofloxacin data. The latter curve was obtained by randomly selecting 10 SNPs 100 times and averaging the resultant FPR (false positive rate) and TPR (true positive rate) values