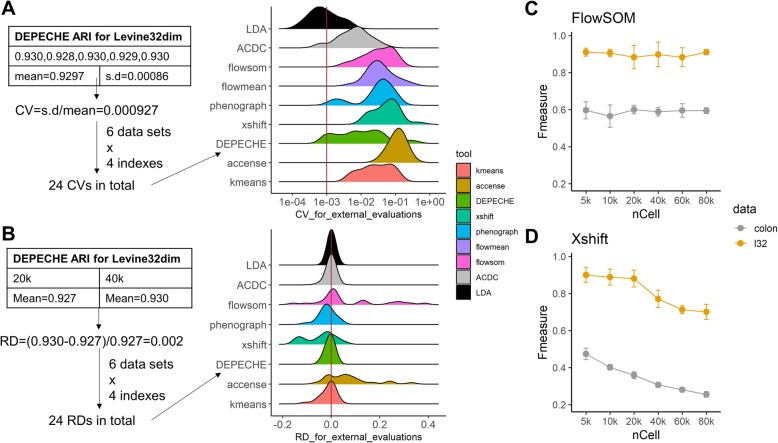
Fig. 2.
Stability of each tool. a Left: schematic diagram showing how coefficients of variation (CVs) were calculated and integrated; right: distribution of CVs for external evaluations for each tool. The red solid line represents median CV for LDA, which is the smallest median CV. b Same as a, but shows distribution of relative difference (RD) between 20,000 cell and 40,000 cell subsampling tests. The red solid line marks RD = 0, which means that there is no difference in performance between 20,000 cell and 40,000 cell subsampling tests. c Precision of FlowSOM on Levine32dim and colon datasets changed as sample size changed. d Same as c, but for Xshift

