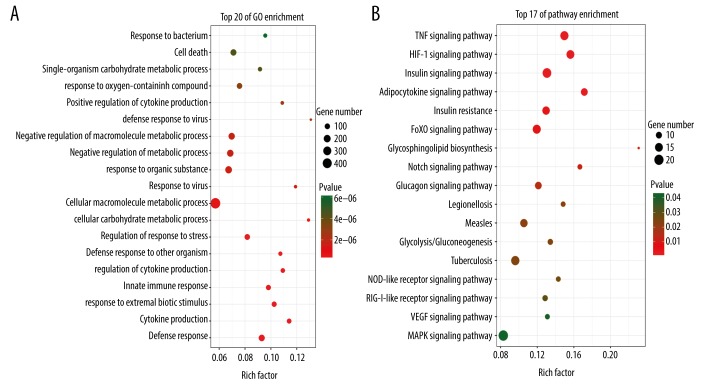
Figure 2.
Gene Ontology (GO) pathway analysis of differentially expressed genes (DEGs). (A) and (B) show the results of GO and pathway analysis of differentially expressed genes (DEGs). The darker the red represents P-value, and the darker the green represents the P-value. The size of the dots represents the number of genes in different items. The rich factor is the proportion of DEGs in each item.

