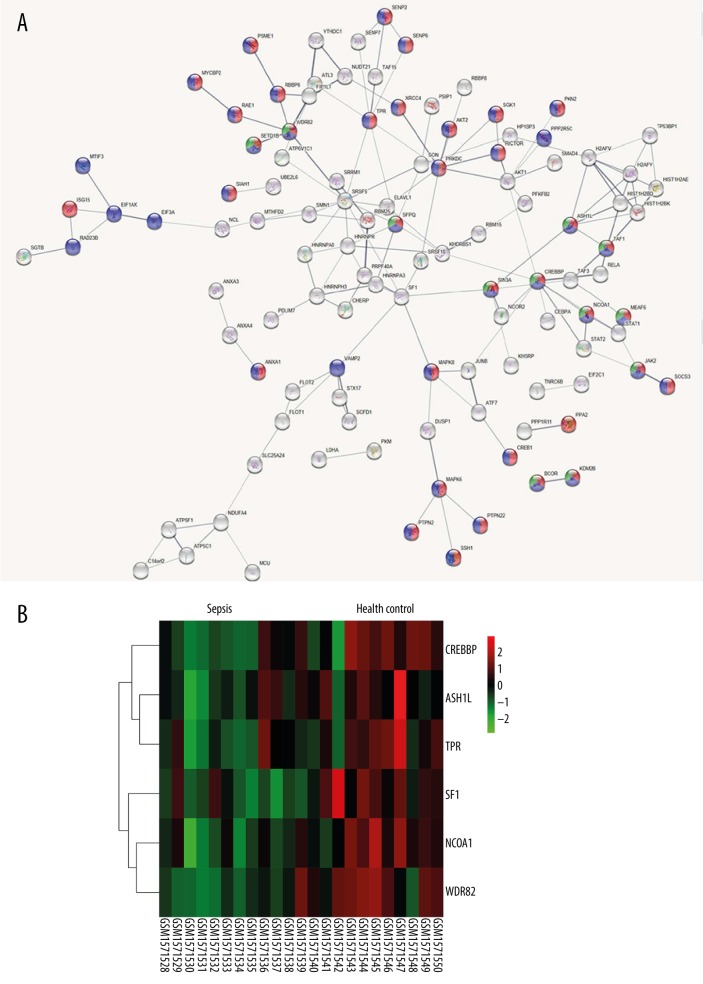
Figure 3.
The protein-protein interaction (PPI) networks based on the screened differentially expressed genes (DEGs). (A) The PPI networks based on DEGs screened above. Red represents the cellular protein modification process, green represents histone modification, and blue represents cellular protein metabolic process. (B) The heat map of the six potential core genes in GSE64457 (WDR82, ASH1L, NCOA1, TPR, SF1, and CREBBP). Red represents relatively high expression, while green represents relatively low expression.

