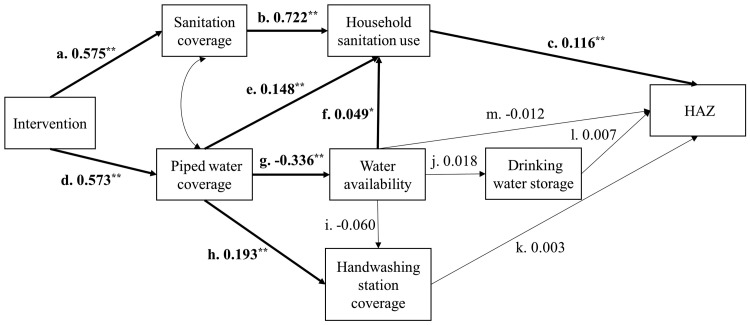
Figure 2.
Structural equation model with standardized path coefficients for the relationships among intervention status, improved sanitation coverage, household sanitation use, on-premise piped water coverage, reported interruption in water availability, household drinking water storage, handwashing station coverage, and height-for-age z-score (HAZ). Bold lines indicate significant associations (* P < 0.05, ** P < 0.01).

