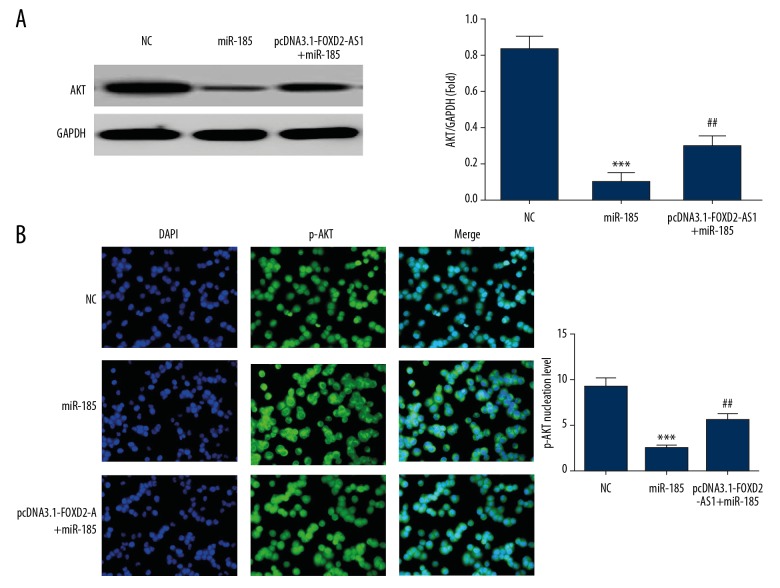
Figure 9.
AKT and p-AKT proteins expression in difference groups. (A) AKT protein expression in difference groups by western blot assay. *** P<0.001 compared with NC group; ## P<0.01, compared with miR-185 group. (B) p-AKT protein nuclear volume in difference groups by cellular immunofluorescence. *** P<0.001 compared with NC group; ## P<0.01, compared with miR-185 group.

