Figure 5.
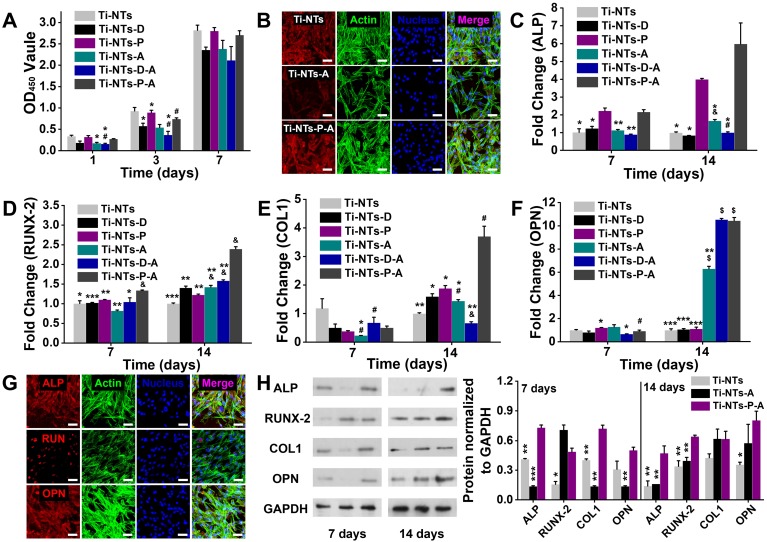
In vitro biocompatibilities and osteogenic activities of the substrates. (A) CCK-8 assay of hBMSCs on the indicated surfaces after 1, 3 and 7 days of culture. * denotes p < 0.05 and ** denotes p < 0.01 compared to Ti-NTs, # denotes p < 0.05 compared to the corresponding control group without peptides. Error bars denote the standard deviations over quadruplicate measurements with separately implants. (B) Confocal fluorescence microscopy images of hBMSCs stained with vinculin, F-actin and DAPI after being cultured for 24 h. Scale bar, 50 μm. (C-F) qRT-PCR assay of osteogenic gene expression of (C) ALP, (D) RUNX-2, (E) COL1 and (F) OPN of hBMSCs after 7 and 14 days of culture. * denotes p < 0.05, ** denotes p < 0.01 and *** denotes p < 0.001 compared to Ti-NTs-P-A; # denotes p < 0.05, & denotes p < 0.01 and $ denotes p < 0.001 compared to the corresponding control group without peptides. All error bars denote the standard deviations over quadruplicate measurements with separately implants. (G) Immunofluorescence staining of hBMSCs cultured on Ti-NTs-P-A for 7 days (ALP and RUNX-2) and 14 days (OPN). The images were obtained by confocal fluorescence microscopy. Scale bar, 50 μm. (H) Western blotting of hBMSCs cultured on the substrates for 7 and 14 days. At each time point, left lane was Ti-NTs, middle lane was Ti-NTs-A and right lane was Ti-NTs-P-A. * denotes p < 0.05, ** denotes p < 0.01 and *** denotes p < 0.001 compared to Ti-NTs-P-A. Error bars denote the standard deviations over triplicate measurements with separately Western blotting results.

