Figure 6.
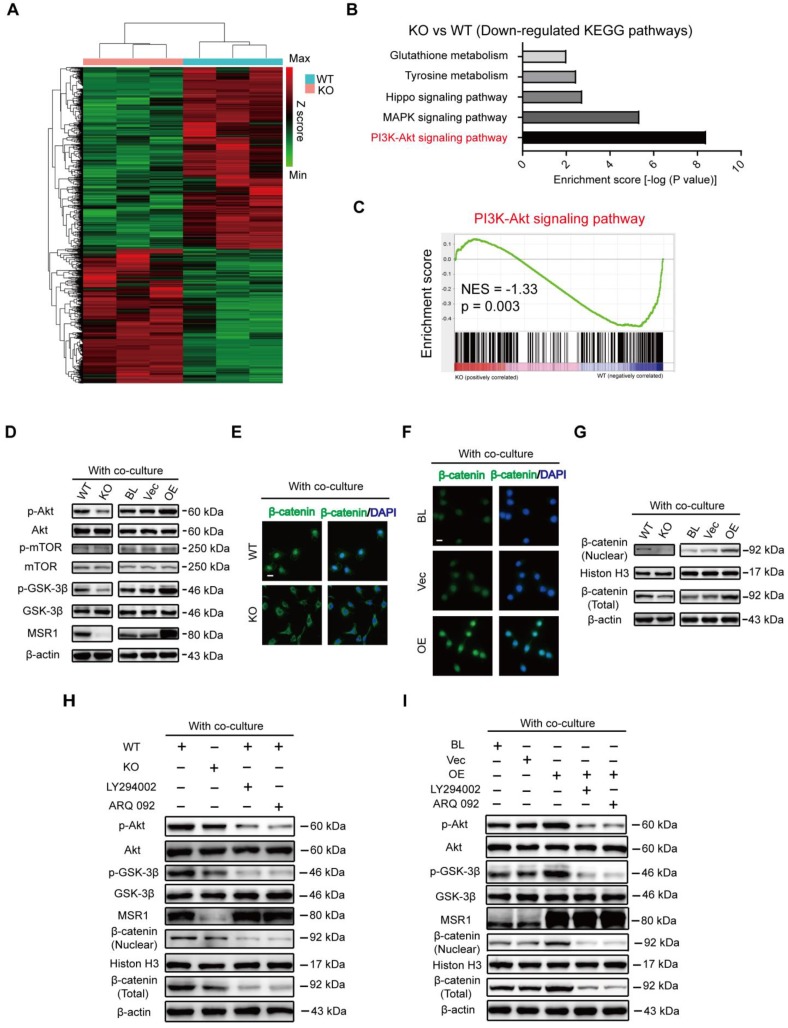
MSR1 activates macrophage PI3K/AKT/GSK3β/β-catenin signaling in the co-culture system (A) Heat map of DEGs of MSR1 KO or WT BMDMs after co-culturing with BMSCs. Green and red colors represent low and high expression values, respectively. (B) Representative down-regulated KEGG pathway categories affected by MSR1 depletion in macrophages. (C) Gene set enrichment analysis (GSEA) was used to identify the distribution of genes in the PI3K/AKT pathway gene set of MSR1 KO and WT groups. NES, normalized enrichment score. (D) Immunoblot images showing the effect of MSR1 KO or overexpression on the expression of p-AKT/AKT, p-mTOR/mTOR, and p-GSK3β/GSK3β after co-culturing with BMSCs. (E and F) Distribution of β-catenin (green) in MSR1 WT and MSR1 KO macrophages (E), and MSR1 BL, Vec, and overexpressing RAW264.7 cells (F) were analyzed by IF staining. The cell nuclei were stained with DAPI (blue fluorescence), Scale bars: 50 μm. (G) Immunoblot images showing the role of MSR1 KO or OE on the expression of β-catenin from nuclear and whole-cell lysates. (H) Altered protein expression levels of p-AKT/AKT, p-GSK3β/GSK3β, β-catenin (nuclear), and β-catenin (total) were detected using Western blotting in MSR1 KO and WT macrophages in the co-culture system, or in MSR1 WT macrophages treated with LY294002 (an inhibitor of PI3K), ARQ 092 (an inhibitor of AKT) before co-culture. (I) Protein expression levels of p-AKT/AKT, p-GSK3β/GSK3β, β-catenin (nuclear), and β-catenin (total) were detected using Western blotting in MSR1 BL, Vec and OE RAW264.7 cells in the co-culture system, or MSR1 OE RAW264.7 cells treated with LY294002 (an inhibitor of PI3K), ARQ 092 (an inhibitor of AKT) before co-culture.

