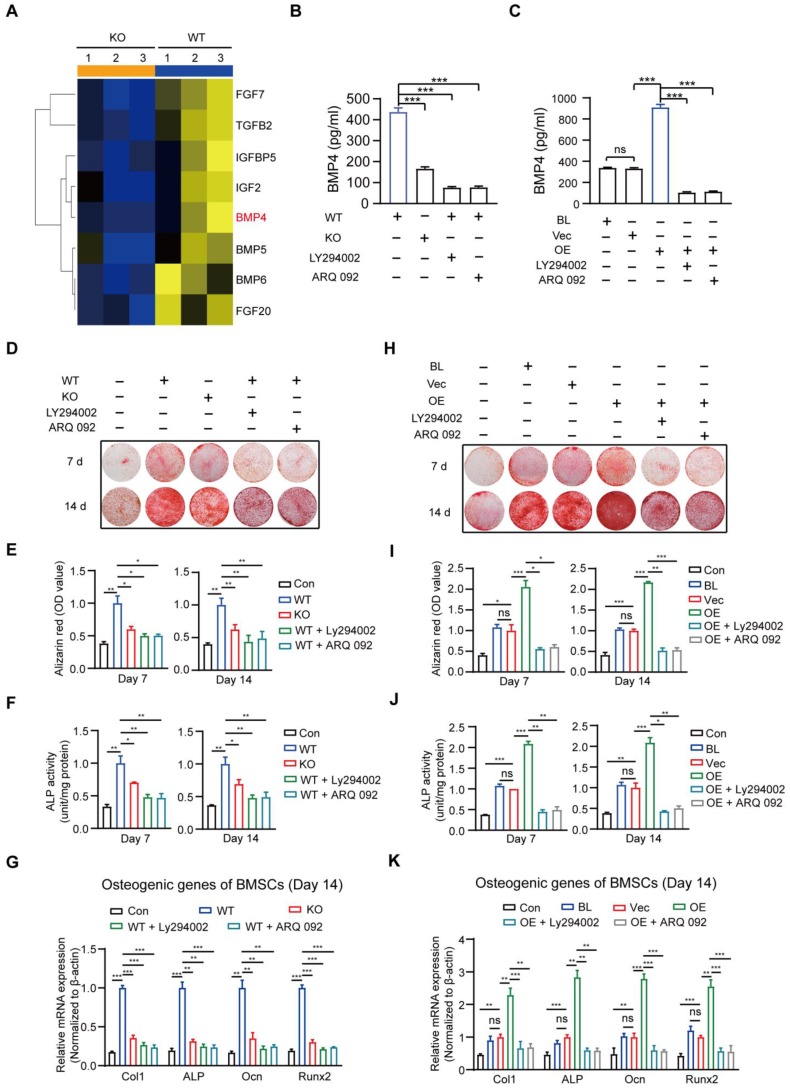
Figure 7.
MSR1-activated macrophage PI3K/AKT/GSK3β/β-catenin signaling promotes osteogenic differentiation of BMSCs. (A) Heat map of several genes encoding molecules involved in BMSC osteogenic differentiation was performed based on the results of RNA sequencing (MSR1 KO vs. WT). Blue and yellow colors represent low and high expression values, respectively.(B) The amount of secreted BMP4 in 24-h in the serum-free medium by MSR1 WT and MSR1 KO macrophages after co-culture, or MSR1 WT macrophages treated with LY294002 or ARQ 092 before co-culture was assessed by ELISA. Values are expressed as mean ± SD, ***p < 0.001. (C) The amount of secreted BMP4 in 24-h serum-free MSR1 BL, Vec, and OE RAW264.7 cells after co-culture, or MSR1 OE RAW264.7 cells treated with LY294002, ARQ 092 before co-culture was determined by ELISA. Values are expressed as mean ± SD, ***p < 0.001. (D-F) In the co-culture system, knockout of MSR1 or inhibition of PI3K/AKT/GSK3β/β-catenin signaling in macrophages impaired pro-osteogenic differentiation of BMSCs as observed by AR staining (D). Quantitative evaluation of AR staining results (E) and ALP activities (F) on day 7 and 14 was performed. BMSC without co-culture was used as the Con group. Values are expressed as mean ± SD, *p < 0.05, **p < 0.01. (G) mRNA expression levels of osteogenic biomarkers (Col1, ALP, Ocn and Runx2) in osteogenic differentiated BMSCs on day 14 were detected by qPCR in different groups. β-actin was used as an internal control. Values are expressed as mean ± SD, **p < 0.01, ***p < 0.001. (H-J) Inhibition of PI3K/AKT/GSK3β/β-catenin signaling in MSR1 OE RAW264.7 cells in the co-culture system decreased osteogenic differentiation of BMSCs as observed by AR staining (H). Quantitative evaluation of AR staining results (I) and ALP activities (J) on day 7 and 14 was performed. Values are expressed as mean ± SD, *p < 0.05, **p < 0.01, ***p < 0.001, ns indicates no significance. (K) mRNA expression levels of Col1, ALP, Ocn and Runx2 in osteogenic differentiated BMSCs on day 14 detected by qPCR in the indicated groups. β-actin was used as an internal control. Values are expressed as mean ± SD, **p < 0. 01, ***p < 0.001, ns indicates no significance.

