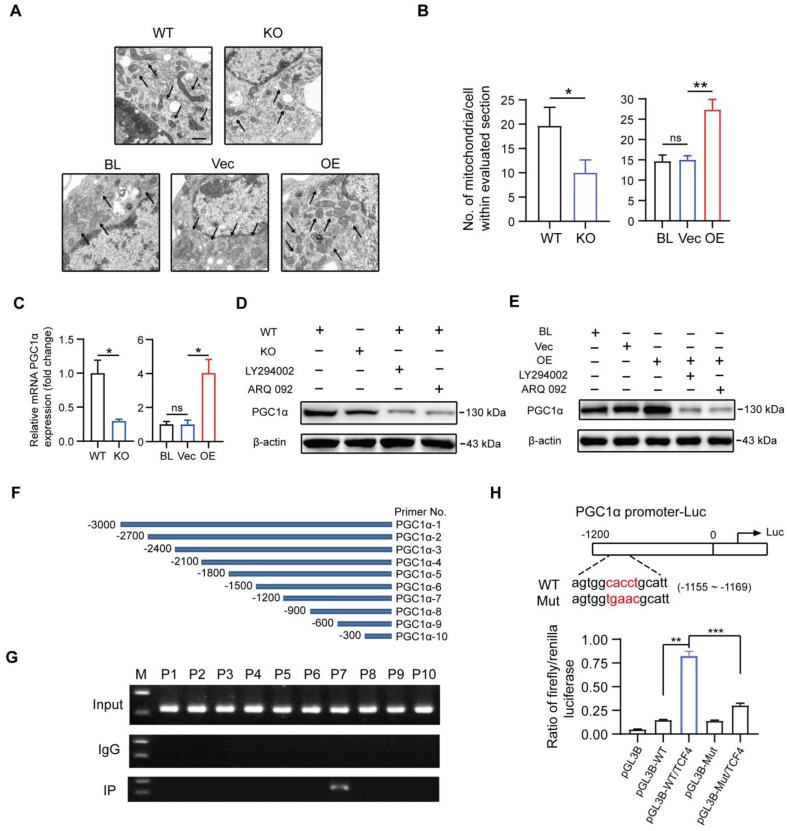
Figure 8.
Macrophage MSR1 regulates the expression of PGC1α in the co-culture system. (A) The number of mitochondria per cell in different groups was evaluated by transmission electron microscopy. Black arrows indicate mitochondria. Scale bars: 500 nm. (B) Quantification of the number of mitochondria per cell in the imaged section. Values are mean ± SD, *p < 0.05, **p < 0.01, ns indicates no significance. (C) mRNA expression levels of PGC1α in MSR1 WT and MSR1 KO macrophages, and MSR1 BL, Vec, and MSR1 OE RAW264.7 cells were determined by qPCR. Values are mean ± SD, *p < 0.05, ns indicates no significance. (D) Altered protein expression level of PGC1α was detected by Western blotting in MSR1 KO macrophages in the co-culture system, or MSR1 WT macrophages treated with LY294002, ARQ 092 before co-culture. (E) Immunoblot images of the protein expression level of PGC1α in MSR1 BL and Vec RAW264.7 cells in the co-culture system, or MSR1 OE RAW264.7 cells treated with LY294002, ARQ 092 before co-culture. (F) Diagram depicting 10 pairs of primers in the promoter region of PGC1α. (G) ChIP assay was performed to confirm the potential TCF-binding site in the PGC1α promoter region in macrophages. Immunoprecipitated DNA was amplified with a series of primers covering the 3000 bp sequence upstream from PGC1α transcription start site. (H) Luciferase reporter assay was performed using macrophages after transfecting the wild-type and mutant PGC1α promoter (mutation site: red). Values are mean ± SD, **p < 0.01, ***p < 0.001.

