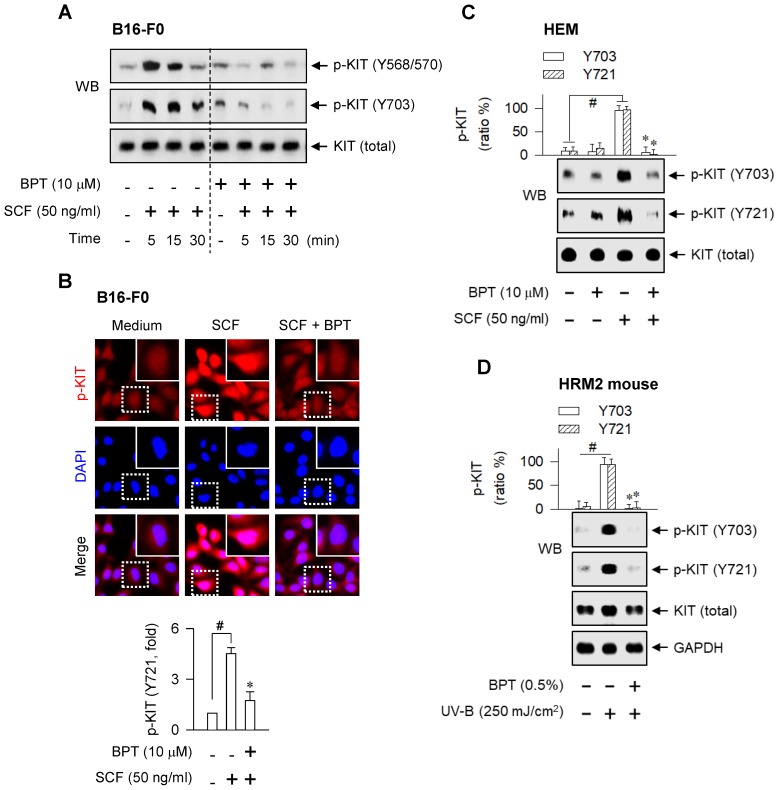
Figure 10.
SCF- or UV-B-induced KIT autophosphorylation. SCF-induced KIT autophosphorylation. Cells were pretreated with BPT for 2 h and stimulated with SCF for 10 min (B, C) or indicated time points (A) in the presence of BPT. (A, C) Western blot analysis (WB). (B) Confocal fluorescence microscopy, displaying the p-KIT in red and the nuclei in blue (upper), and p-KIT levels as relative fold (lower). (D) WB on the UV-B-induced KIT autophosphorylation. The dorsal skin of HRM2 mice was irradiated with UV-B and treated topically with BPT as shown in Figure S1D. Data are mean ± SEM. #P < 0.05 vs. medium alone (B, C) or normal skin (D). *P < 0.05 vs. SCF alone (B, C) or UV-B alone (D).

