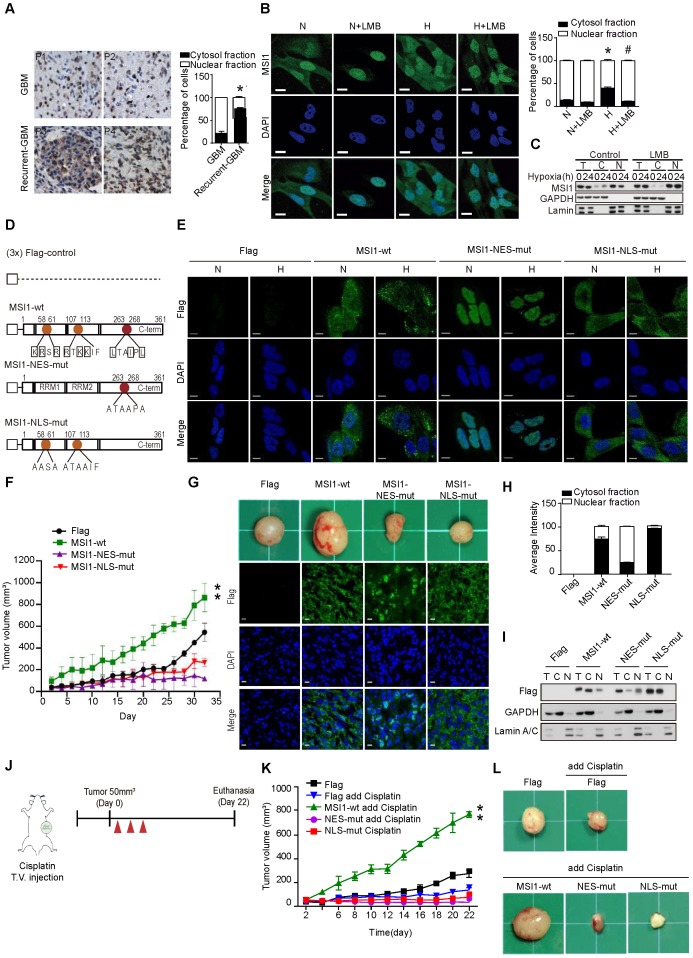
Figure 1.
Translocation of MSI1 into the cytosol correlates with tumor progression and cell proliferation under stress conditions. (A) IHC staining for MSI1 in primary (n = 67) and recurrent (n = 32) GBM. Magnifying power: 200× (top) and 600× (bottom). Quantitation of cells expressing cytoplasmic or nuclear MSI1 is shown in the bar graph on the right. (B) 05MG cells pre-treated with or without nuclear export inhibitor leptomycinB (LMB) (10 ng/mL, 2 hr) under normoxia or hypoxia conditions for 24 hr were subjected to anti-MSI1 (green) immnunostaining and DAPI (blue) nuclear counterstaining. Images were acquired from Carl Zeiss confocal microscope system. The intensity of green fluorescence in nuclear and cytosol was quantified and shown as relative percentage in the graph at the right. (C) Total protein (T), nuclear (N), and cytoplasmic (C) fractionations of 05MG cells under normoxia or hypoxia (24 hr) in the presence or absence of LMB (10 ng/mL) were subjected to immunoblotting with MSI1, Lamin A/C (nuclear internal control) and GAPDH (cytosolic control) antibodies. (D) A schematic presentation showing the mutation sites in the NLS (orange) and NES (red) motifs of human MSI1. All constructs were sub-cloned into p-3xFlag-Myc-CMV expression vector. (E) 05MG cells stably transfected with the Flag-control, Flag-tagged MSI1-wt, MSI1-NES-mut, or MSI1-NLS-mut were subjected to normoxia (N) or hypoxia (H) treatment for 24 hr and then immunostained with anti-Flag antibody (green). Images were acquired from Carl Zeiss confocal microscope system, and the quantification of fluorescent intensity in the nuclear and cytosolic compartments was shown as relative percentage in the graph at the left. (F) Null mice were subcutaneously transplanted with 05MG/Flag-control, 05MG/MSI1-wt, 05MG/MSI1-NES-mut or 05MG/MSI1-NLS-mut cells. Tumor size was measure with a caliper at the indicated time points. The 05MG/MSI1-NES-mut and 05MG/MSI1-NLS-mut tumors showed similar growth curves as the 05MG/Flag-control cells, while the 05MG/MSI1-wt tumor grew much more rapidly. N = 6. **P < 0.05 vs. 05MG/Flag-controlcells. (G) Xenograft tumors were excised (top), and tumor tissues were subjected to immunostaining to evaluate the expression and distribution of Flag-control, Flag-tagged MSI1-wt, MSI1-NES-mut, and MSI1-NLS-mut proteins (bottom). Images were acquired from Carl Zeiss confocal microscope system. (H) The intensity of green fluorescence in nuclear and cytosol was quantified and shown as relative percentage in the graph at the right. (I) Tumor tissue were harvested and homogenized. Whole-tumor lysates were subjected to Western blot analysis. Data represent the mean ± S.D. of three independent experiments performed in triplicate. (J) A schematic depicting the experimental design for subcutaneously transplanted. (K-L) Null mice were subcutaneously transplanted with 05MG/Flag-control, 05MG/MSI1-wt, 05MG/MSI1-NES-mut, or 05MG/MSI1-NLS-mut cells. Two days after the tumor size reached 50 mm3, mice started cisplatin (20 mg/kg) or PBS administered via tail-vein injection for total 3 times with 2-day interval. The tumor size was measured with a caliper at the indicated time points. Xenograft tumors were excised 40 days after DDP treatment. N = 6, **P < 0.05.

