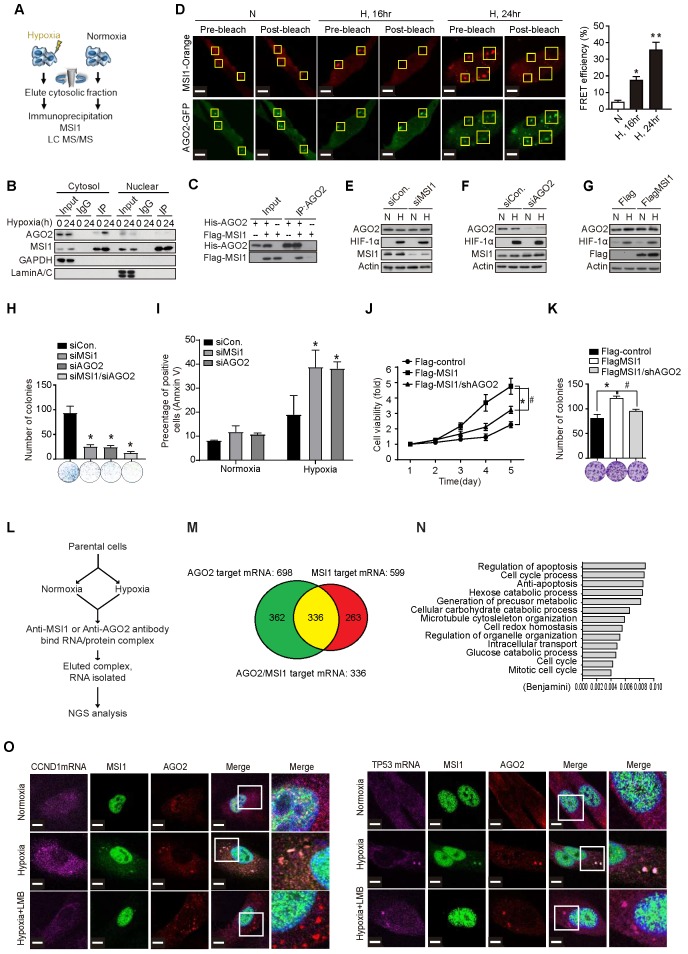
Figure 2.
MSI1 interacts with AGO2 and binds to their common downstream mRNA targets under hypoxia. (A) A schematic illustrating the procedure for identifying hypoxia-induced binding partners of MSI1. (B) Co-immunoprecipitation of endogenous AGO2 with MSI1 antibody in the cytosol or nuclear fraction of 05MG cells under hypoxia for indicated period of time. (C) In vitro binding assay of purified baculovirus-expressed His-tagged AGO2 and Flag-tagged MSI1 proteins. (D) 05MG cells-expressing FRET pairs of MSI1-orange and AGO2-GFP were bleached at the region of interest (ROI) indicated by yellow boxes. Unbleached controls (pre-bleach) were also shown in parallel. Left, representative images of MSI1 (orange) and AGO2 (green) before and after photobleaching experiments. Right, quantification of FRET photobleaching experiments was performed by calculating FRET efficiencies for the FRET pairs MSI1 (orange)-AGO2 (green). (E-G) Western blotting confirmed endogenous expression levels of MSI1, AGO2, HIF-1α and actin in MSI1-knockdown cells (E), AGO2-knockdown cells (F), and MSI1-overexpressed cells (G). (H) 05MG with AGO2-knockdown were subjected to an MTT viability assay. The relative fold change of the number of viable cells in each day was presented in the graph. (I) The percentage of apoptotic cells of control, MSI1-knockdown and AGO2-knockdown cells were determined by external Annexin-V under normoxiac and hypoxic conditions. (J) 05MG/Flag-control, 05MG/Flat-MSI1-wt, and 05MG/MSI1-wt with AGO2-knockdown (Flag-MSI1/shAGO2) were subjected to an MTT viability assay. The relative fold change of the numbers of viable cells in each day was presented in the graph. (K) 05MG/Flag-control, 05MG/MSI1-wt and 05MG/MSI1-wt/shAGO2 cells were subjected to colony formation assay for 10 days, and the numbers of colony were quantitated by ImageJ software. (L) Flow-chart of preparing RNA-binding protein immunoprecipitation (RIP) samples for NGS analysis (RIP-seq). (M) Intersection of mRNA targeted by MSI1 and AGO2. (N) Gene ontology (GO) enrichment analysis was conducted by DAVID software according to the category of biological processes. Benjamini ≤ 0.05 is selected as interesting GO. The GO accession, name, and the corresponding p-value were shown in the graph. (O) 05MG cells pre-treated with or without LBM (10 ng/mL, 2 hours) and cultured in hypoxia condition for 24 hours were stained for TP53 and CCND1 mRNAs (TAS-cy5, cherry-red), MSI1 (green), and AGO2 (red). Merged images of co-localization of MSI1/AGO2/mRNA (white) by confocal microscopy are shown.

