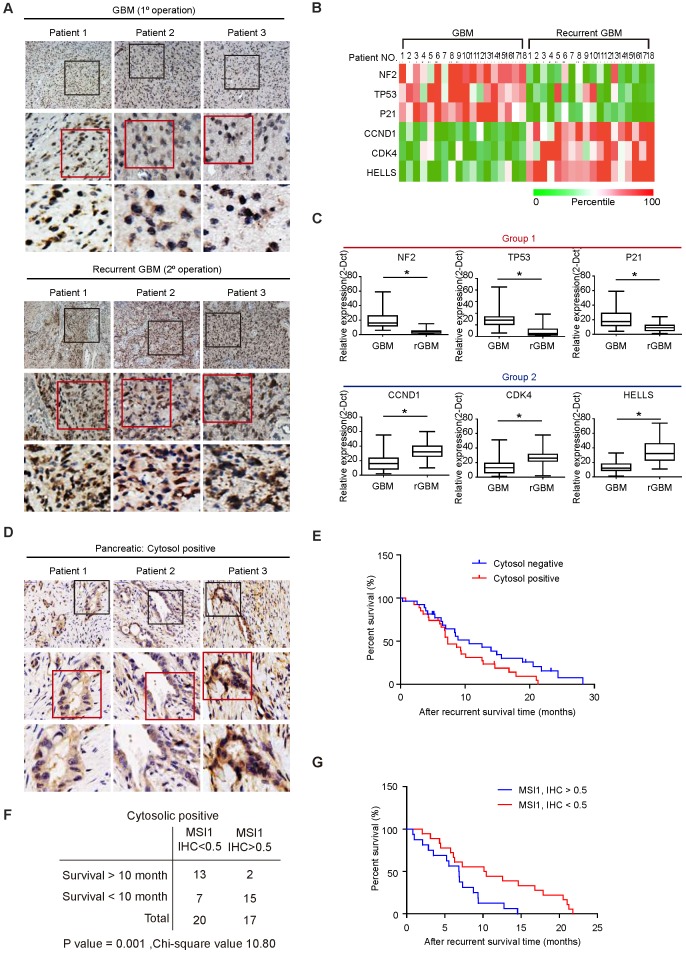
Figure 8.
Cytosolic MSI1 expression associates with GBM relapse and PDAC recurrence in patients. (A) MSI1 expression was examined by IHC in 18 paired primary and recurrent GBM tissues. Three representative cases (Pt 1 to 3) were presented. Boxes highlighting MSI1 expression pattern. (B) qPCR analysis of NF2, TP53, p21, CCND1, CDK4, and HELLS mRNA expression levels in microdissected tumor (T) and stroma (S) samples from the 18 paired primary and recurrent GBM specimens. All mRNA expression levels in T parts were first normalized by that in respective S counterparts, and then the total 36 expression levels (primary and recurrent) of each mRNA were rated as percentile from 0% (green) to 100% (red). A heat map shows the relative mRNA expression levels between paired primary and recurrent GBM tissue. (C) qPCR analysis of NF2, TP53, p21, CCND1, CDK4, and HELLS mRNA levels in a group of primary (N = 67) and recurrent (N = 32) GBM tissues (*P < 0.01). P values were estimated by a log-rank test. (D) 61 recurrent PDAC patient samples were collected and stained for MSI1 by IHC. 3 representative cases showed positive stain of cytosolic MSI1. (E) Survival analysis of the cytosolic MSI1-positive (cytosol-positive; N = 37) and cytosolic MSI1-negative (cytosol-negative; N = 24) recurrent PDAC patients indicates that cytosolic MSI1-positive patients have poorer survival outcome than cytosolic MSI1-negative patients. (F) In the 37 cytosol-positive PDAC cases, the expression level of cytosolic MSI1 were evaluated by IHC score. In the 20 cases with cytosolic MSI1 IHC score < 0.5, 13 cases survived over 10 months after recurrence; while in the 17 cases with cytosolic MSI1 IHC score > 0.5, only 2 cases survived over 10 months after recurrence. P = 0.001; Chi-square = 10.80. (G) Post-recurrent survival analysis of the two groups (IHC score > 0.5 and IHC score < 0.5) of cytosol-positive PDAC patients.

