Figure 1.
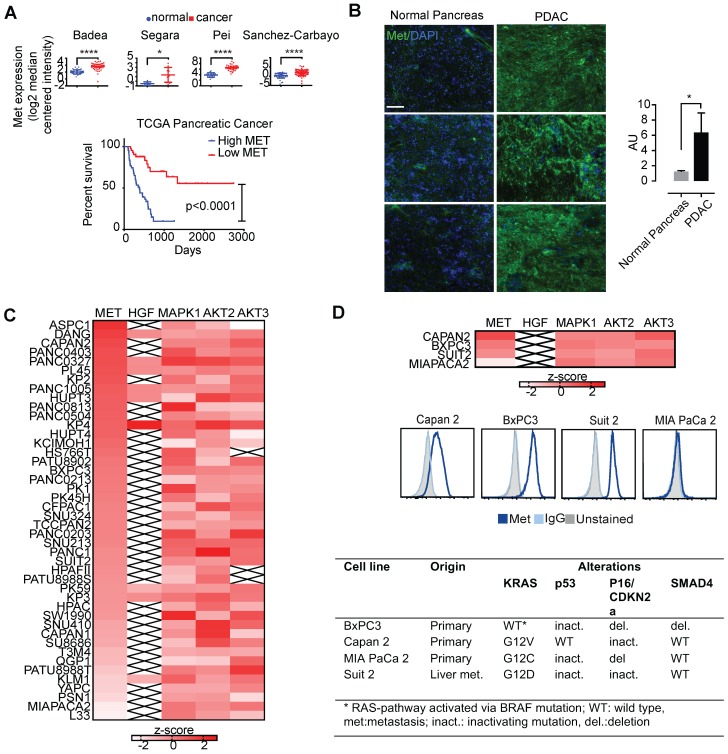
Several human cancers demonstrate over-expression of Met. A. Analysis of previously published patient gene expression datasets using oncomine.org listing log2 median centered intensity values across several (note: first author of relevant manuscript used to denote individual study, N=normal tissue, C=cancer). Kaplan-Meier survival curve of TCGA pancreatic cancer patients with high Met (top 25%) and low Met (bottom 25%) expression (Log-rank (Mantel-Cox) test, p <0.0001). B. patient matched normal pancreas (left) and pancreatic adenocarcinoma (right), and quantitation (ratio of green:blue, scale bar: 50μm). AU=arbitrary units is a ratio determined by measuring total of pixels positive for green (Met staining) versus total stain for blue (DAPI, cell nuclei). C. Heatmap denoting differential gene-expression of Met, HGF and downstream kinases for all pancreatic cancer cell lines in The Cancer Cell Line Encyclopedia, and, D. (top panel) focused heatmap of the cell lines used in the current study (“x”= null value on dataset). D (middle panel) Flow cytometry histograms confirming higher cell-membrane expression of Met in Capan 2, Suit 2, and BxPC3 when compared with MIA PaCa-2. D (bottom panel) Mutations present in four PDAC cell lines used in this study (note: while BxPC3 is RAS wildtype, it harbors an activating BRAF mutation). Error bars denote standard deviation (± s.d), p<0.05 = *, p<0.01= **, p<0.0005 = ***, p<0.0001 = ****, NS: not significant, p >0.05).

