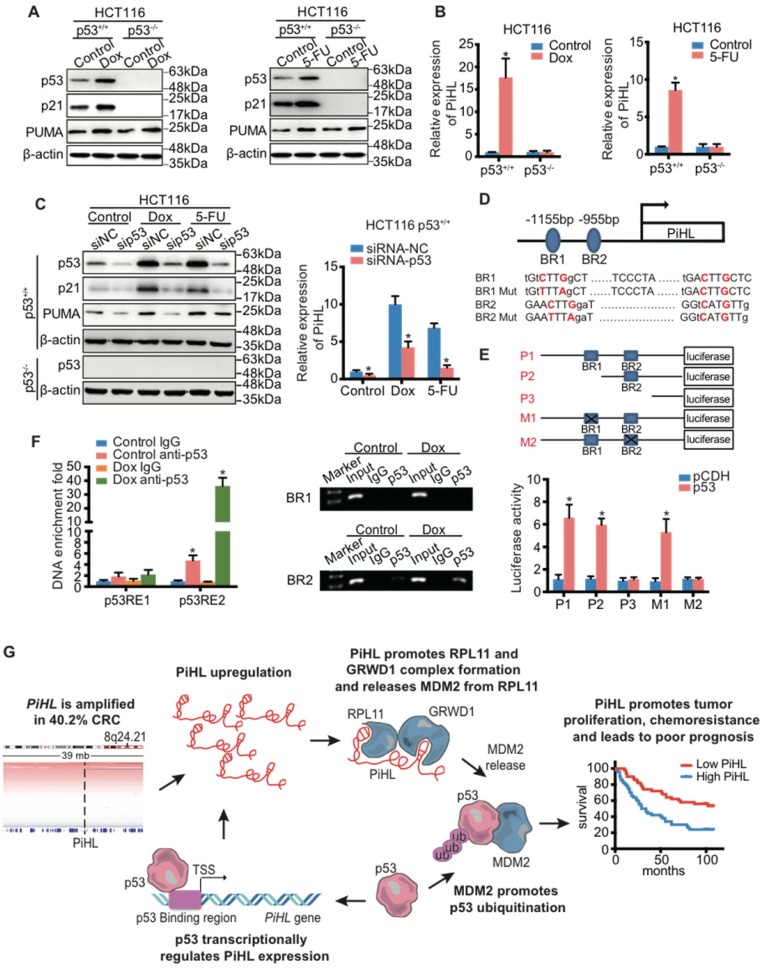
Figure 6.
PiHL is a direct transcriptional target gene of p53. (A, B) HCT116 cells were treated with chemotherapy drugs Doxorubicin (Dox) (300 nM) or 5-Fluorouracil (5-Fu) (100 μM) for 20 h before analyses of RNA and protein levels. The protein levels of p53 and p53 targets were detected using immunoblotting analysis with indicated antibodies (A). PiHL levels were measured using RT-qPCR (B). (C) The effect of p53 knockdown on the protein levels and PiHL levels after treated cells with chemotherapy drugs. CRC cells were transfected with siRNA-NC or siRNA-p53 for 48 h, and treated with Dox or 5-Fu for 20 h before the cells were harvested for immunoblotting with indicated antibodies or RT-qPCR. β-actin served as the control. Data are shown as mean ± s.e.m.; two-tailed Student's t-test. (D) Two potential p53 binding regions (BR1 and BR2) were identified in the human PiHL promoter region using computer software (p53MH algorithm). The mutations of BR1 and BR2 were generated by site-directed mutagenesis. (E) Top: Truncation and mutation of PiHL promoter. P1 is a full-length promoter; P2 carries p53BR2; P3 carries neither p53BR1 nor p53BR2; M1 is a mutant at p53BR1 and M2 is a mutant at p53BR2. Bottom: Relative luciferase activity for corresponding constructs in HCT116 cells with p53 overexpression or controls. Error bars represent mean ± s.e.m, n = 3. *P < 0.05 by two-tailed t-test. (F) Confirmation of p53 binding to p53BR2 in PiHL promoter as detected by ChIP assay. HCT116 cells were treated with 1 mM Dox for 20 h, and ChIP assays were performed with the p53 antibody or control IgG. The promoter regions of indicated genes were analyzed by RT-qPCR. Error bars represent ±s.e.m, n = 3. *P < 0.05 by two-tailed t-test. (G) A proposed model of the functional consequence of PiHL overexpression in CRC tumorigenesis.

