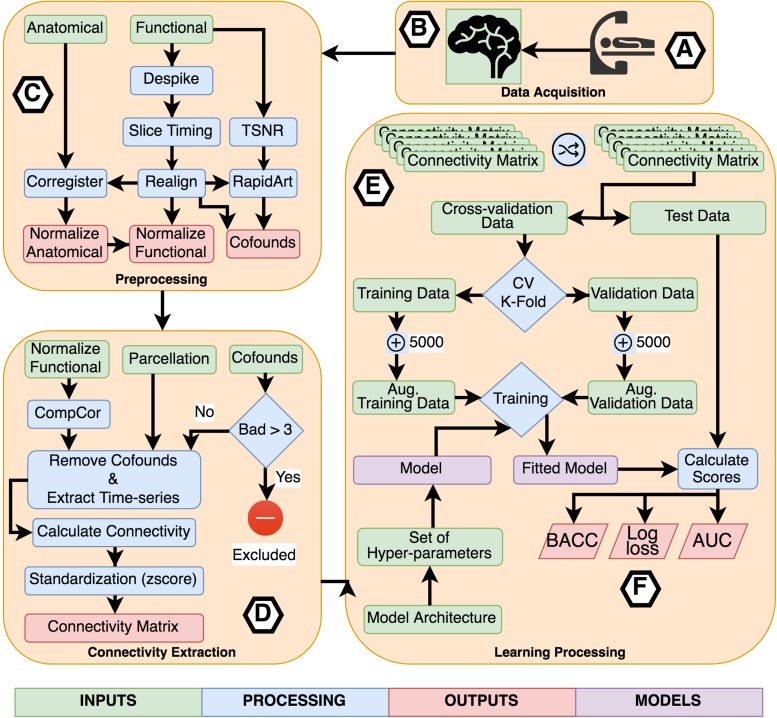
FIGURE 2.
Flowchart describing the entire process of acquisition, preprocessing, processing, learning, and evaluation. (A) Participants were scanned in a resting-state protocol and (B) functional and structural images were collected. (C) Each subject’s images were preprocessed separately applying standard procedures like time-slicing, realigning, coregistration, artifacts detection, and normalization. (D) A connectivity matrix was created for each subject combining a normalized functional image, a set of confounds, a parcelation, and a connectivity measure. (E) The learning processing starts shuffling the list of subject’s connectivity matrix, we preserved the shuffling index to be replicated with the other inputs set combining the different parcelations and connectivity measures. The next step was to select the independent fold used to compare the different fit models. The remainder data was used in the cross-validation process. All models were trained using a k-fold cross-validation scheme with k = 2 to CNN based models and k = 5 for TOPT models. Inside the cross-validation process, from each testing and validation’s dataset, five thousand synthetic connectivity matrices were created. These synthetic data were used to train and validate the model, which is a combination of the model architecture and a specific set of hyper-parameters, including regularization. For the last, (F) the fitted model was evaluated using the independent fold and three scores: Balanced Accuracy (BACC), Log loss, and the Area Under the receiver-operating characteristics curve. These scores were used to compare the performance of architectures, parcelations, and connectivity measures.

