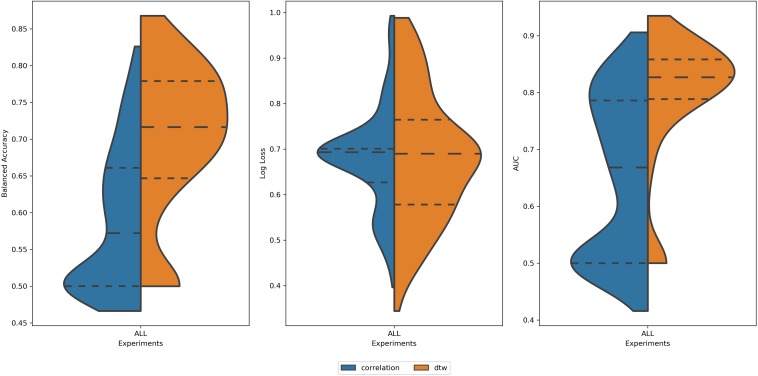
FIGURE 3.
Distribution of values of (left) Balanced Accuracy, (center) Log Loss, and (right) AUC for all 2616 experiments using correlation (blue area) and DTW (orange area). All tails were truncated in maximum and minimum values while the dash lines delimit the quartiles. In the case of Balanced Accuracy and AUC, the distributions for Correlation and DTW differ with p-value < 0.05.

