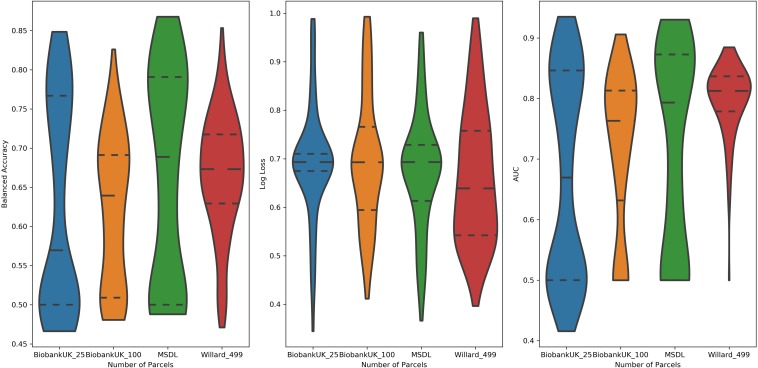
FIGURE 4.
Distribution of values of (left) Balanced Accuracy, (center) Log Loss, and (right) AUC grouped by parcelation size: Biobank_UK_25 (blue), Biobank_UK_100 (Orange), MSDL (green), and Willard (red). All tails were truncated in maximum and minimum values while the dash lines delimit the quartiles.

