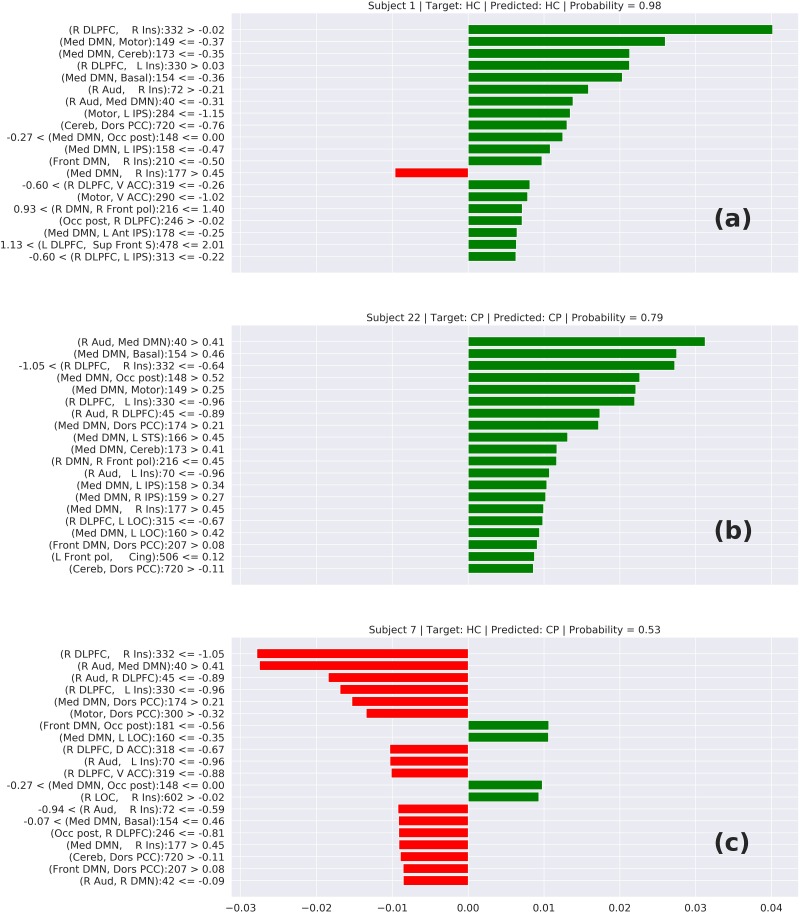
FIGURE 6.
Local interpretable model-agnostic explanations (LIME) for the best TOPT model listing the 20 features that most contribute to the prediction of (a) a correctly predicted HC, (b) a correctly predicted CP, and (c) a wrongly predicted HC. The bars represent how much each feature (axis Y) added to the prediction in terms of probability. Green bars indicate that the feature adds positively, in direction to the target class, while the red bars indicate that the features are in resistance to the target class.

