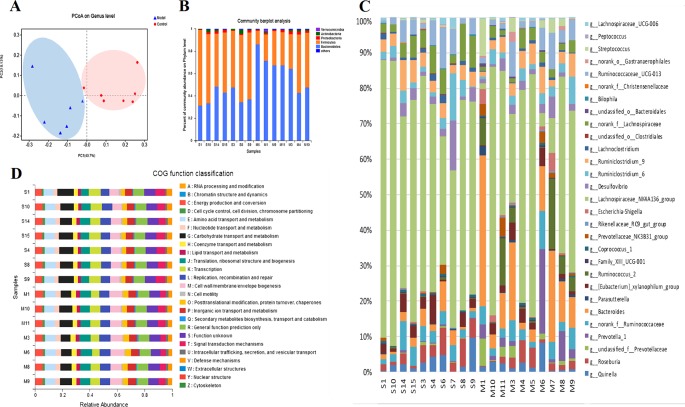
Figure 2.
(A) The gut microbiota patterns of Control group and Model group differentiated by PCoA. The gut microbiota composition profiles at the phylum (B) and genus (C) levels in the Control and Model group as revealed by 16S rRNA gene sequencing; each color represents one bacterial phylum or genus. The x-axis represents different samples. The y-axis represents the percentage abundance of bacteria in each sample. (D) Abundances of PICRUSt-inferred function in the Control and Model samples.

