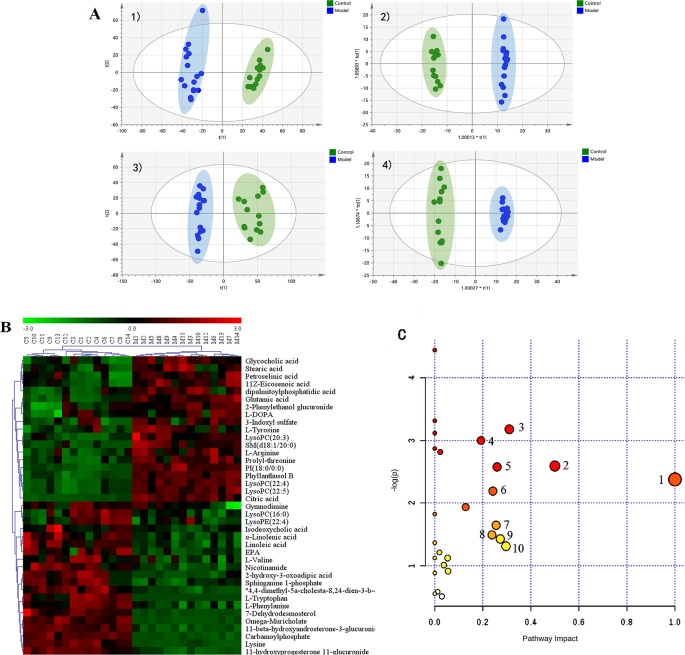
Figure 3.
Metabolic profiles of plasma samples in rats with chronic migraine induced by nitroglycerin (A) 1) PCA score plot in negative mode; 2) OPLS-DA score plot in negative mode (R2Y = 0.997, Q2Y = 0.98); 3) PCA score plot in positive mode; 4) OPLS-DA score plot in positive mode (R2Y = 0.995, Q2Y = 0.973). (B) Significant changes in plasma metabolites are expressed as a heatmap showing metabolite changes in the Control (C) and Model (M) treatment groups, detected by UPLC-Q-TOF/MS. (C) Overview of metabolic pathway analysis: 1. Linoleic acid metabolism 2. Phenylalanine, tyrosine, and tryptophan biosynthesis 3. Tryptophan metabolism 4. Arginine and proline metabolism 5. Alanine, aspartate, and glutamate metabolism 6. Glycerophospholipid metabolism 7. Tyrosine metabolism 8. Nicotinate and nicotinamide metabolism 9. Pentose and glucuronate interconversions 10. Glyoxylate and dicarboxylate metabolism.

