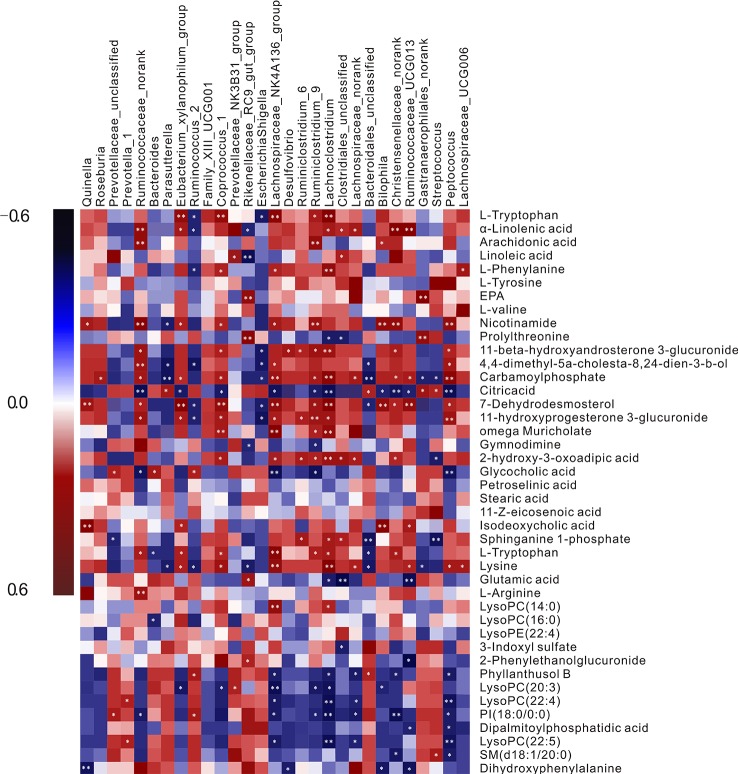
Figure 4.
A correlation heatmap is used to represent significant statistical correlation values (r) between perturbed gut microbiota genera and altered plasma metabolites in the Model group and Control group. Blue squares indicate negative correlations, and red squares indicate positive correlations; the significance of correlation is closely related to the depth of color.

