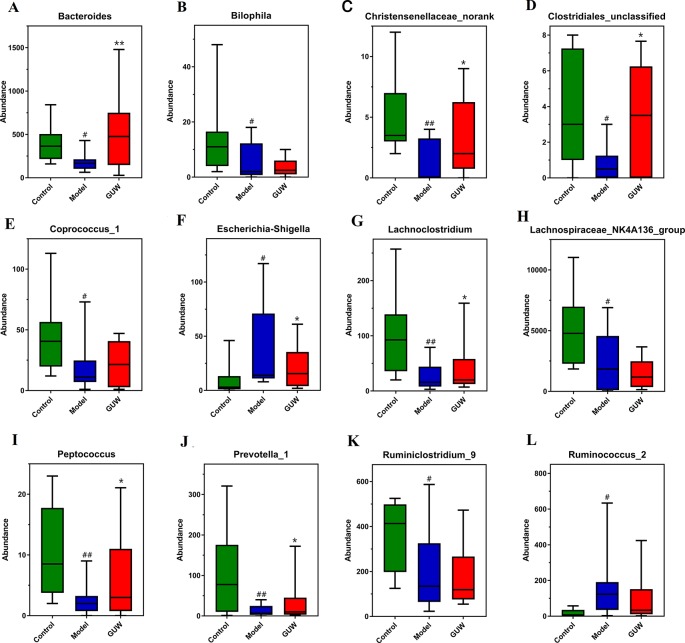
Figure 6.
Regulation of GU on intestinal bacteria in the Model group, *P < 0.05, **P < 0.01 compared with the Model group; # P < 0.05, ## P < 0.01 compared with the Control group. (Control, Control group; Model, Model group; GUW, GU administration of rats in the Model group.) (A) Bacteroides; (B) Bilophila; (C) Christensenellaceae_norank; (D) Clostridiales_unclassified; (E) Coprococcus_1; (F) Escherichia-Shigella; (G) Lachnoclostridium; (H) Lachnospiraceae_NK4A136_group; (I) Peptococcus; (J) Prevotella_1; (K) Ruminiclostridium_9; (L) Ruminococcus_2.

