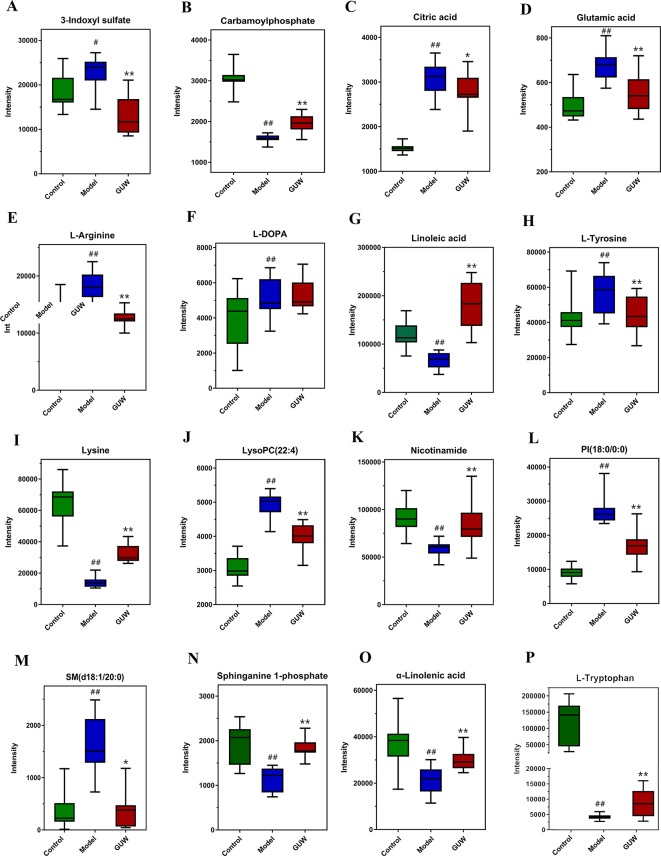
Figure 7.
Expression of plasma biomarkers in all groups, *P < 0.05, **P < 0.01 compared with the Model group; # P < 0.05, ## P < 0.01 compared with the Control group. (Control, Control group; Model, Model group; GUW, GU administration of rats in model group.) (A) 3-Indoxyl sulfate; (B) Carbamoylphosphate; (C) Citric acid; (D) Glutamic acid; (E) L-Arginine; (F) L-DOPA; (G) Linolenic acid; (H) L-Tyrosine; (I) Lysine; (J) LysoPC(22:4); (K) Nicotinamide; (L) PI(18:0/0:0); (M) SM(d18:1/20:0); (N) Sphinganine 1-phosphate; (O) α-Linolenic acid; (P) L-Tryptophan.

