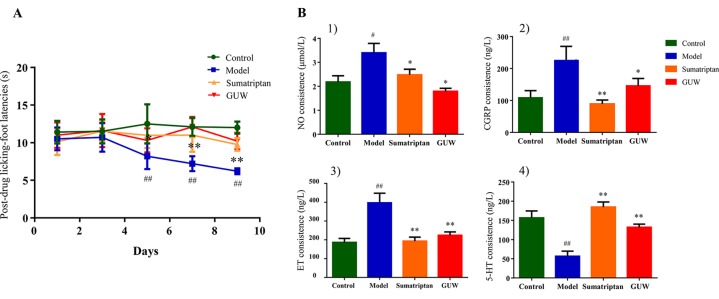
Figure 8.
Chronic NTG-evoked hyperalgesia, which was significantly attenuated by GUW treatment. Data are expressed as mean ± SD (n = 10), *P < 0.05, **P < 0.01 compared with the Model group; # P < 0.05, ## P < 0.01 compared with the Control group (A). Regulation of plasma biochemical indicators levels induced by NTG administration and its reduction by GUW treatment. 1) NO, 2) CGRP, 3) ET, 4) 5-HT. Data are expressed as mean ± SD (n = 10), *P < 0.05, **P < 0.01 compared with the Model group; # P < 0.05, ## P < 0 .01 compared with the Control group (B).

