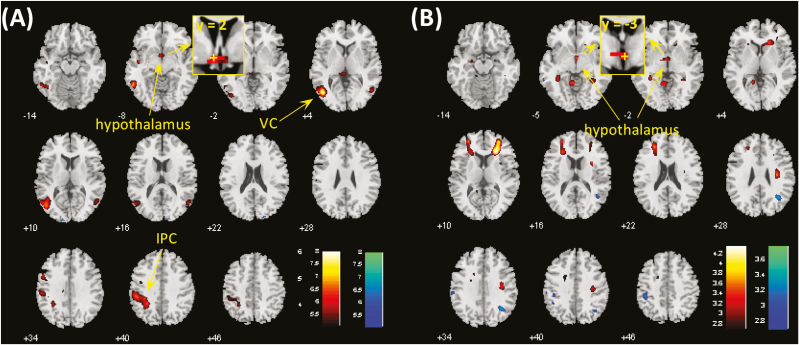
Figure 2.
(A) Brain regions showing differences between cocaine and food cue-induced activation in cocaine-dependent participants (CD) at voxel P < .001. Clusters meeting cluster-level P < .05 whole-brain corrected for familywise error of multiple comparisons or P < .05 familywise error corrected for the hypothalamus mask are summarized in Table 2. Hot color represents clusters showing higher responses to cocaine vs neutral cues as compared with food vs neutral cues, and blue color represents clusters of the opposite contrast. (B) Hypothalamus showed differences in food cue-induced activations between CD and healthy controls (HC) at voxel P < .001 and P < .05 familywise error corrected for the hypothalamus mask. IPC, inferior parietal cortex; VC, visual cortex. The insets showed coronal sections of the brain to highlight the location of the hypothalamic cluster, with “+” indicating the location of voxel peak.

