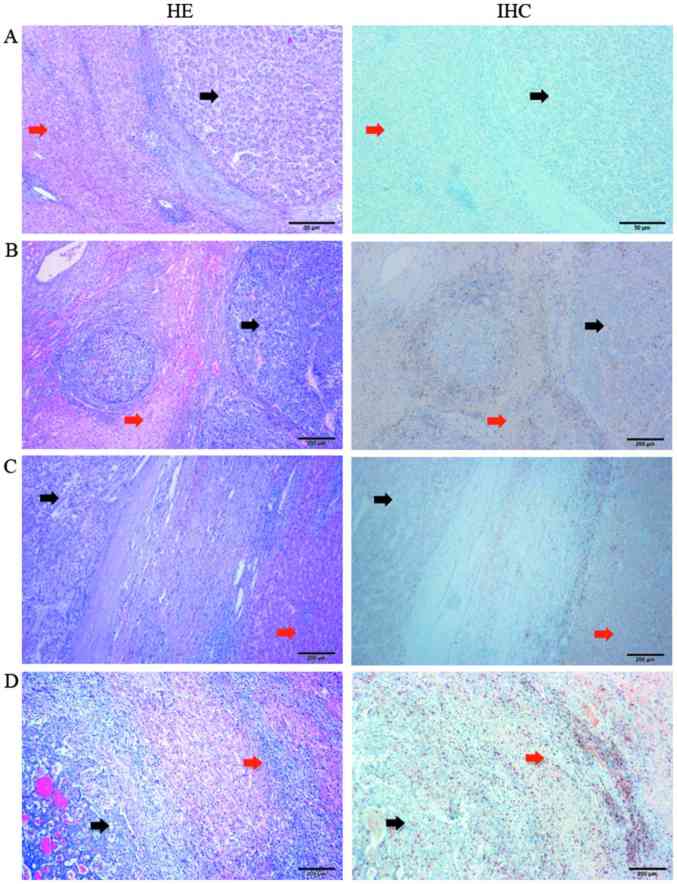
Figure 3.
Location of PD-1+ T lymphocytes in hepatocellular carcinoma tissues. Representative microscope images showing the (A) tumor interior, (B) nodular margin of the tumor, (C) tumor-normal adjacent tissue junction and the (D) liver tissue surrounding the tumor. Black arrows indicate tumor tissues, and red arrows indicate peritumoral tissues (magnification, ×40). PD-1, programmed cell death-1.

