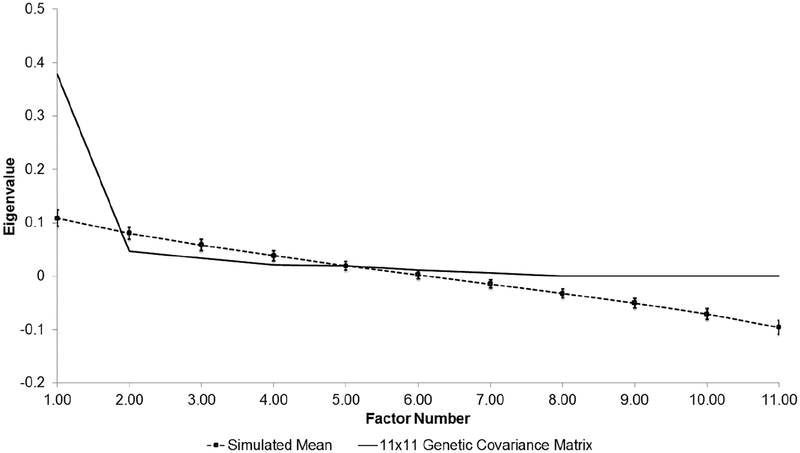
Figure 1. Parallel analysis of 11×11 genetic covariance matrix for DSM-5 AUD symptoms.
Observed eigenvalues (solid line) are compared to 95 percentile of the eigenvalue distribution (dashed line [with standard error]) derived from 1000 randomly generated datasets. All factors left of where the solid lines first intersects with the dashed line are retained and their effects described in Table 4.

