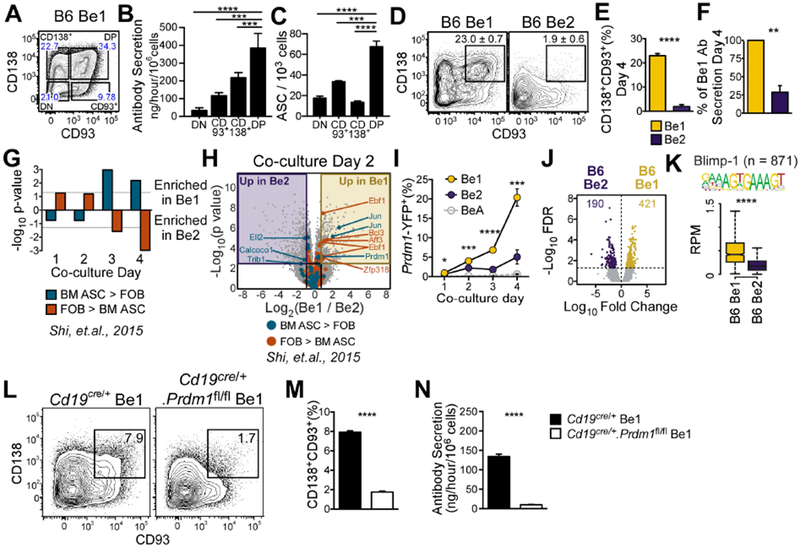
Figure 1. ASC development is preferentially initiated in Th1 cell-primed B cells.

(A-C) Identification of ASCs in sort-purified Be1 cell subsets (A) divided using CD138 and CD93. Ab secretory rates (B) and ELISPOT (C) analyses of each subset.
(D-F) Identification (D) and enumeration (E) of CD138+CD93+ ASCs in Be1 and Be2 cultures. Ab secretory rates (F) of Be1 and Be2 cells shown as % of Be1 Ab secretion.
(G-H) Gene set expression analysis (GSEA) for differentially expressed TF genes in BM ASCs vs FOB cells (Shi et al., 2015) in days 1-4 Be1 and Be2 microarray (MA) data (G). Day 2 volcano plot (H) highlighting TF genes significantly (FDR<0.05, ≥1.75 FC) upregulated in BM ASCs or FOB (Shi et al., 2015).
(I-N) Analysis of Blimp1 in Be1 and Be2 cells.
(I) Enumeration of Blimp-1 reporter (YFP+) expressing Be1, Be2, and control BeA cells generated from Blimp-1 reporter mice by flow. Be1 vs Be2 p values shown.
(J) Volcano plot of day 2 B6 Be1 and Be2 cell ATAC-seq data showing 611 DAR (FDR<0.05).
(K) Chromatin accessibility within 100bp surrounding Blimp-1 binding motifs in Day 2 Be1 and Be2 cells by ATAC-seq. n= number of motif-containing DARs analyzed. p = 3.8×10−90.
(L-N) Identification (L) and quantification (M) of CD138+CD93+ ASCs in day 4 Be1 cultures containing control (Cd19cre/+) or Blimp-1 deficient (Cd19cre/+.Prdm1fl/fl) B cells. Day 4 Ab secretory rates (N).
Data representative of ≥2 independent experiments (A-E, I, L-N), representative pooled data from 4 independent experiments (F), 7 independent experimental samples/timepoint/group (MA) or 3 independent experimental samples/group (ATAC-seq). Data presented as mean + SD of ≥3 experimental replicates (B-C, E, I, M-N); mean ± SEM of 4 independent experiments (F); bar plot of nominal p values (G) or box and whisker plots (showing interquartile range and upper and lower limit) (K). p values determined using one-way ANOVA (B-C) or Student’s t test (E-F, I, K, M-N). See Supplemental STAR Methods for description of Be1 and Be2 cultures, DAR identification, and statistical analyses of GSEA and MA datasets. *p<0.05, **p≤0.01 ***p≤0.001, ****p≤0.0001, “ns” not significant. See also Figure S1 and Supplemental Tables 1–2.
