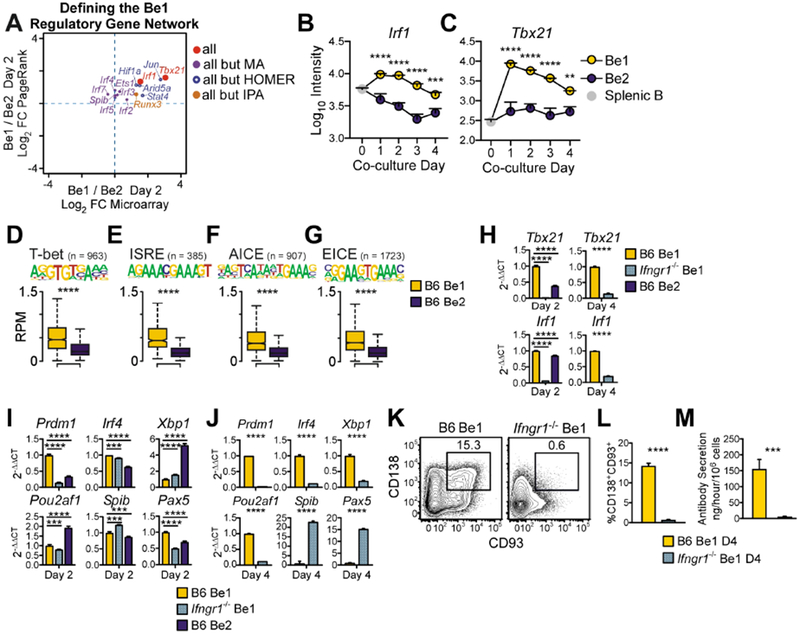
Figure 2. IFNγR signals control Be1 differentiation into ASCs.

(A) TF regulators of the day 2 Be1 gene network as predicted by HOMER motif, Ingenuity Pathway (IPA) upstream regulator, PageRank (PR) and DEG analyses using day 2 Be1 and Be2 MA and ATAC-seq data. TFs predicted by all 4 analyses or 3 of 4 analyses are shown as MA Log2 FC vs PR Log2 FC.
(B-C) MA expression of Irf1 (B) and Tbx21 (C) by day 0 (splenic B) and day 1-4 Be1 and Be2 cells. Be1 vs Be2 p values shown.
(D-G) Chromatin accessibility within 100bp surrounding T-bet (D) and IRF (E-G) binding motifs in Day 2 Be1 and Be2 cells by ATAC-seq. n= number of motif-containing DAR analyzed. p values 1.6×10−68 (D), 3.1×10−49 (E), 5.9×10−74 (F), and 5×10−137 (G).
(H-J) qPCR analysis (see STAR Methods) of day 2 (H-I) or day 4 (H,J) B6 Be1, Ifngr1−/− Be1 or B6 Be2 cells.
(K-M) Identification (K) and quantification (L) of CD138+CD93+ ASCs in day 4 B6 and Ifngr1−/− Be1 cultures. Day 4 Ab secretory rates (M).
Data in H-M representative of 2 (H-I) or ≥3 (J-M) independent experiments. Shown as the mean + SD of ≥ 3 PCR (H-J) or experimental (L-M) replicates. MA data shown as mean ± SEM (B-C) of 7 experiments. ATAC-seq data shown as box and whisker plots (D-G) of 3 independent experimental samples/group. p values determined by Student’s t test (D-G, J, L-M), one-way ANOVA (H-I), or two-way ANOVA (B-C). **p≤0.01 ***p♤0.001, ****p≤0.0001, “ns” not significant. See also Figure S2 and Supplemental Table 3.
