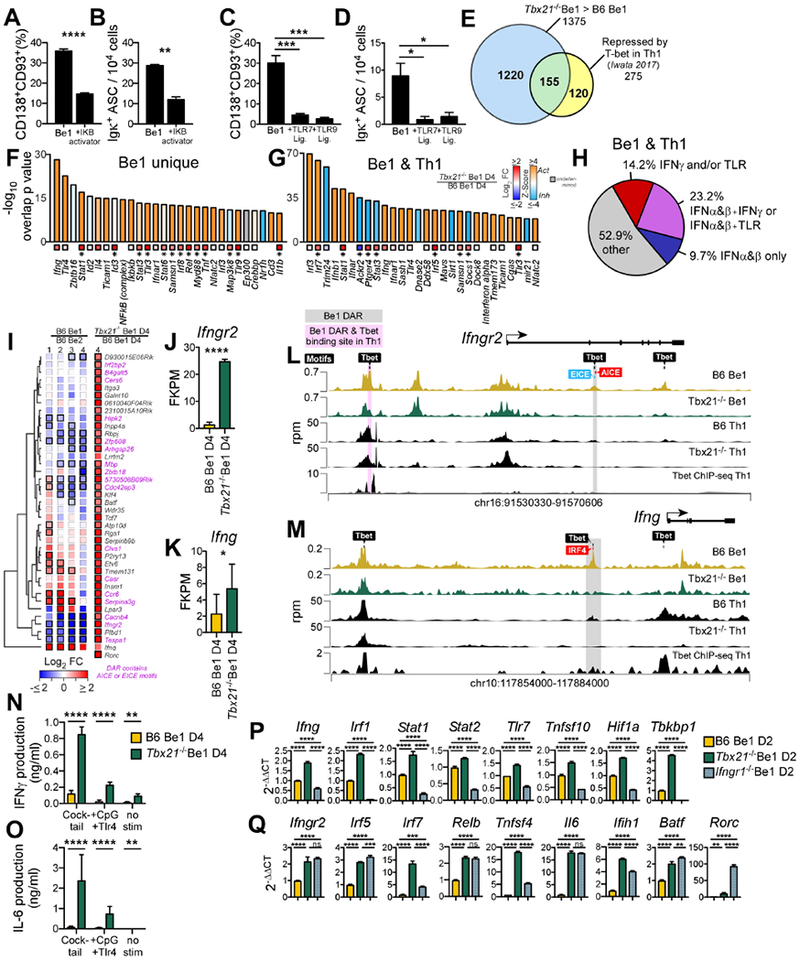
Figure 5. T-bet supports Be1 ASC formation by repressing the IFNγR-regulated inflammatory gene program.

(A-D) NF-κB activator (Betulinic acid, (A-B)), R848 (C-D), CpG (C-D) or Vehicle (A-D) was added to day 2 B6 Be1 cultures. ASCs enumerated by flow (A, C) or ELISPOT (B, D) on day 4.
(E) Venn diagram showing T-bet repressed genes in Th1 cells ((Iwata et al., 2017), n=275) and in Be1 cells (n=1375). Indicated are genes unique to Be1 cells (1220, blue), unique to Th1 cells (120, yellow), or shared (155, green).
(F-G) IPA predicted regulators of T-bet repressed genes identified in (E) that are unique to Be1 cells (F) or shared between Be1 and Th1 cells (G), showing overlap p value (see STAR Methods) and activation Z-score (bars) and FC expression in day 4 Tbx21−/− Be1 over B6 Be1 (squares with *=FDR <0.05,).
(H) IPA analysis of the 155 T-bet repressed genes shared between Be1 and Th1 cells to identify genes that are induced (activated) by IFNα (or IFNβ) ± IFNγ ± TLR signals. Data shown as % of targets that are activated by individual or multiple upstream regulators.
(I) mRNA expression heatmap of T-bet repressed genes, based on FC>2, p< 0.05 in day 4 Tbx21−/− Be1 over B6 Be1 cells by RNA-seq, that also map to T-bet binding motif containing DARs (FDR <0.05 by ATAC-seq in in day 2 B6 and Tbx21−/− Be1 cells, n=40). FC B6 Be1 over B6 Be2 (MA) or Tbx21−/− Be1 over B6 Be1 (RNA-seq) is shown. Bold borders indicate FDR<0.05. Genes with DARs containing AICE or EICE binding motifs noted in pink. Genes (rows) clustered based on Euclidean distance of FC and complete linkage. Rorc was not detected in Be1 or Be2 samples.
(J-K) RNAseq expression (FPKM) for Ifngr2 (J) and Ifng (K) in day 4 Tbx21−/− Be1 and B6 Be1 cells.
(L-M) Chromatin accessibility (rpm, reads per million) by ATAC-seq, within Ifngr2 (L) and Ifng (M) loci in day 2 B6 Be1 (gold) and Tbx21−/− Be1 (green) cells and day 4 B6 and Tbx21−/− Th1 cells (black). Shaded boxes indicate DAR (FDR<0.05) in Be1 only (grey) or Be1 and Th1 cells (pink,(Zhu et al., 2012)). Binding motifs for T-bet, AICE, EICE, and IRF4 are indicated.
(N-O) IFNγ (N) and IL-6 (O) production by Day 4 Tbx21−/− Be1 and B6 Be1 cells before or after stimulation with anti-Ig F(ab’)2+anti-CD40+LPS+CpG (cocktail) or LPS+CpG.
(P-Q) qPCR analysis (described in STAR Methods) of Day 2 Tbx21−/−, Ifngr1−/− and B6 Be1 cells.
Data shown representative of 2 (B, N-O, P-Q) or 3 independent experiments (A, C-D) and reported as mean + SD of 3-4 experimental replicates (A, C), duplicate dilutions (B, D, N-O), or PCR triplicates (P-Q). Analysis includes 3 (RNA-seq) or 7 (MA) samples/group/timepoint. Statistical analysis performed using Student’s t test (A-B, J-K), one-way ANOVA (C-D, P-Q), or two-way ANOVA (N-O). Genes with an overlap p value <0.05 by IPA (see STAR methods for description) were predicted to be upstream regulators. *p<0.05, **p≤0.01, ***p≤0.001 or ****p≤0.0001 or “ns” not significant. See also Figure S5 and Supplemental Tables 6–7.
