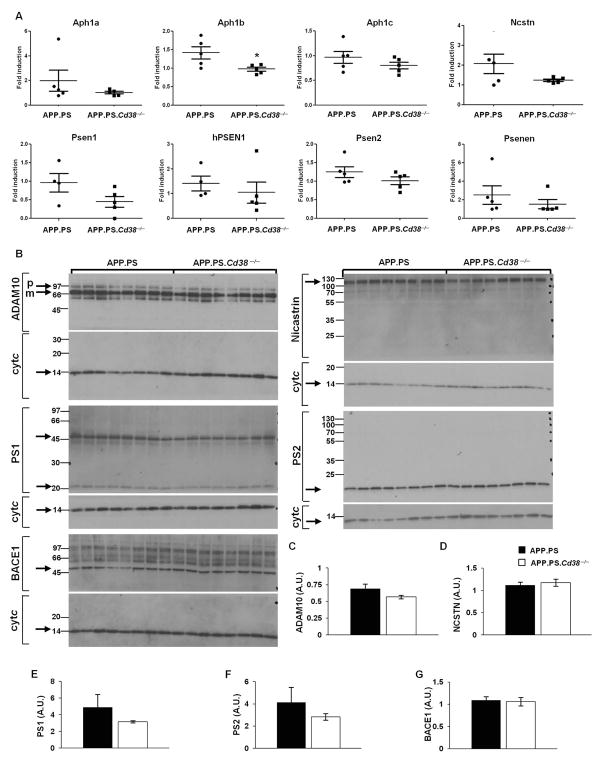
Figure 4. mRNA and protein levels’ measurements of the different secretases.
(A) Total RNA samples, prepared from brain hemispheres, were analyzed by RT-qPCR as described in Materials and Methods to determine relative mRNAs levels of the γ-secretase components; human PS1 transgene (PSEN1), mouse PS1 (Psen1), Psen2, Ncstn, Psenen, Aph1a, Aph1b and Aph1c. The results are expressed as fold induction for each animal in both groups relative to one APP.PS mouse. The data are presented as individual value plots displaying the relative expression level of the indicated gene for each mouse. (n = 4–5). (*p < 0.05, Student’s t test). (B–G) Protein levels of ADAM10, β and γ-secretase components. Brain hemispheres from 10 week old APP.PS and APP.PS.Cd38−/− mice were dissected, and protein extracts were prepared as described in Materials and Methods. (B) Proteins (50 μg) were separated on SDS-PAGE and probed with antibodies against the indicated proteins. Cytochrome c (cyt c) was used as loading control. The membranes were cut into two parts and each part was stained separately for either the corresponding protein or for cytochrome c for normalization. (C–G) Densitometry was used to normalize protein levels in the samples to cytochrome c. Quantification of the normalized results did not reveal a difference in ADAM10 (C), nicastrin (D), PS1 (E), PS2 (F) and BACE1 (G) protein levels between the groups. The values are presented as the mean ± SEM (bars). (n = 8).

