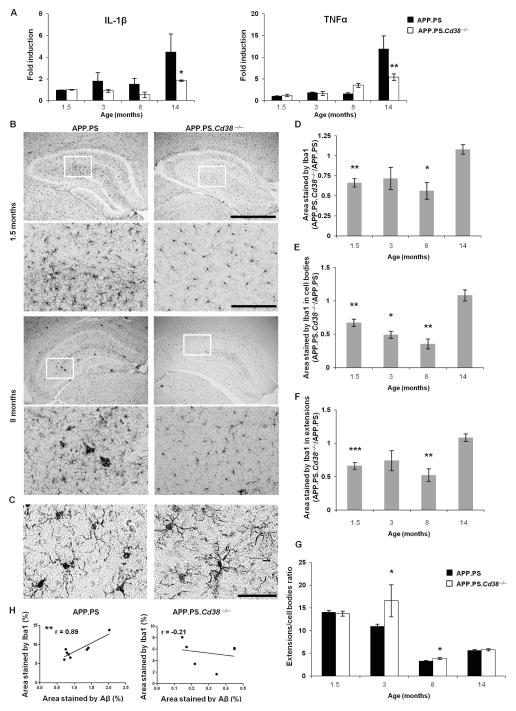
Figure 6. CD38 regulates MM accumulation in the brains of APP.PS AD-prone mice.
(A) Analysis of IL-1β and TNFα mRNA levels in MM isolated from APP.PS and APP.PS.Cd38−/−. MM were isolated from the brains of the two groups at 1.5, 3, 8 and 14 months of age, RNA was extracted and gene expression was examined by qRT-PCR as described in Materials and Methods. (For IL-1β, p = 0.04 for genotype and p = 0.03 for age, two-way ANOVA, *p < 0.05, Fisher’s LSD post-hoc test. For TNFα, p = 0.0005 for age and p = 0.02 for the age × genotype interaction, two-way ANOVA, **p < 0.005, Fisher’s LSD post-hoc test). The values are presented as the mean ± SEM (bars) (n = 2 pools of 2–3 mice for each group). (B) Representative images of Iba1 staining in hippocampi of APP.PS and APP.PS.Cd38−/− mice at 1.5 and 8 months of age. Images were captured at a 4× (upper panel) and 20× magnification (lower panel). Rectangles indicate areas taken for 20× magnification. Scale bar = 1000 μm or 200 μm for upper and lower panels, respectively. Higher resolution representative (60×) images in the in hippocampi of 8 month old APP.PS and APP.PS.Cd38−/− mice are shown in (C). Scale bar = 50 μm. (D) Quantification of the total area stained by Iba1. The results are expressed as the ratio between APP.PS.Cd38−/− and APP.PS. (*p < 0.05 and **p < 0.005, student’s t-test). (E) Quantification of the area occupied by the MM cell bodies in the hippocampus. Differentiation between cell bodies and extension was based on higher Iba1 staining intensity in cell bodies than in extensions. Thus, implementing differential range of intensity of the Iba1 staining, cell bodies were identified as high intensity staining areas and extensions were identified as low intensity staining areas. The results are expressed as the ratio between APP.PS.Cd38−/− and APP.PS. (*p < 0.05 and **p < 0.005, student’s t-test), (F) Quantification of the area stained by the MM extensions in the hippocampus. The results are expressed as the ratio between APP.PS.Cd38−/− and APP.PS. (**p < 0.005 and ***p < 0.0005, student’s t-test). (G) Quantification of the ratio between the area of the MM extensions and the MM cell bodies. The results are expressed as the ratio between APP.PS.Cd38−/− and APP.PS. (*p < 0.05, student’s t-test).The values are presented as the mean ± SEM (bars). (n = 8 for all groups except for APP.PS.Cd38−/− 3 months of age, n = 6). (H) Correlation between the extent of Aβ and Iba-1 staining at 8 months of age. For each mouse, the average total area stained by Aβ was plotted against the average total area stained by Iba1 in the hippocampus. A significant correlation was found only in APP.PS mice (pearson’s r = 0.89, **p < 0.005). (n = 8 for APP.PS and n = 6 for APP.PS.Cd38−/− mice).

