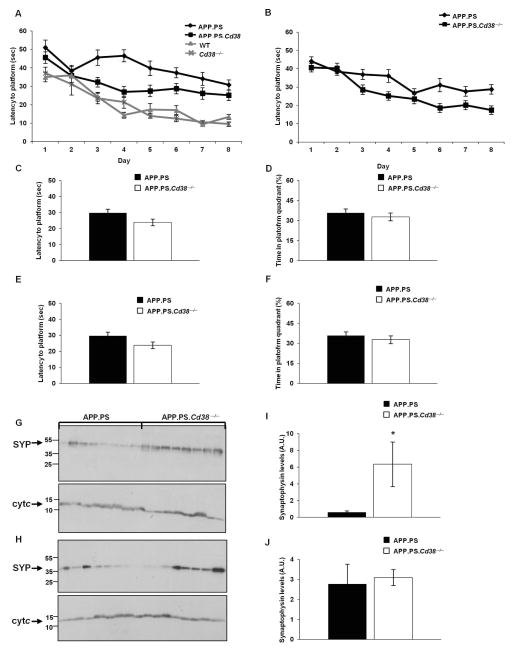
Figure 7. Loss of CD38 improves spatial learning in APP.PS mice.
(A) Morris Water Maze Test. 10 month old APP.PS, APP.PS.Cd38−/−, WT and Cd38−/− mice were tested. The results presented are the average latency of 4 daily trials to reach the hidden platform for each of the 8 days of the learning phase of the task. (p < 10−17 for day and p = 2×10⁻¹² for transgene, repeated measures ANOVA, p = 5×10⁻⁵ between APP.PS and APP.PS.Cd38−/− mice, p = 0.66 between WT and Cd38−/− mice, p = 10−5 between APP.PS.Cd38−/− and WT mice, p = 2×10⁻⁶ between APP.PS.Cd38−/− and Cd38−/− mice, Fisher’s LSD post hoc test). (n = 8, 11, 9, 10 for APP.PS, APP.PS.Cd38−/−, WT and Cd38−/− mice respectively). (B) APP.PS and APP.PS.Cd38−/− were tested at 14 months of age. The results presented are the average latency of 4 daily trials to reach the hidden platform for each of the 8 days of the learning phase of the task. (p < 10−17 for day and p = 0.0017 for CD38, repeated measures ANOVA). (n = 20). (C, E) Visible platform test. The results shown are latencies to climb a visible platform. No significant difference (student’s t-test) was observed between the latencies of APP.PS mice and APP.PS.Cd38−/− mice at 10 (C) or at 14 months of age (E). (D, F) Single probe trial test. The test was conducted 24 h after the last learning trial. The results shown are the percentage of the time that the mice spent in the quadrant in which the platform was previously located. No significant difference (student’s t-test) was observed between APP.PS and APP.PS.Cd38−/− mice at 10 (D) or 14 months of age (F). The values are presented as the mean ± SEM (bars). (G–J) Expression of synaptophysin. The cortex of APP.PS and APP.PS.Cd38−/− mice at 8 (G) and 14 (H) months of age was dissected, and protein extracts prepared as described in Materials and Methods. Proteins (50 μg) were separated on SDS-PAGE and probed with anti-synaptophysin (SYP) or with anti-cytochrome c (Cyt c) Abs as loading control. (I, J) Quantification of the normalized results at 8 (I) and 14 (J) months of age. (*p = 0.02, Student’s t test). The values are presented as the mean ± SEM (bars). (n = 8).

