Figure 2.
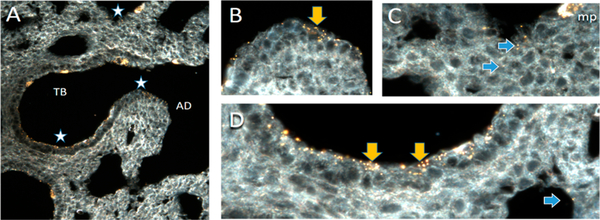
CytoViva dark-field microscopy of AuNPs (100 nm) in the lung of a 3-day-old rat following instillation exposure. NPs localize throughout the terminal bronchiole (TB) and alveolar duct (AD). (A) Overview of region of terminal bronchiole alveolar duct junction. Regions with stars are presented at 60× magnification in B–D. (B) Epithelium lining the transitional region between the end of a terminal bronchiole and the beginning of the alveolar duct contains abundant NPs visible as yellow dots and agglomerates both on the cell surface and within the epithelium (yellow arrow). (C) NPs in the alveoli (blue arrows). An alveolar macrophage (mp) in the upper right corner of the image contains abundant NPs. (D) NPs on the surface and penetrating into the epithelium of the terminal bronchiole (yellow arrows) and the alveolus (blue arrow). Control tissues did not have particles. Particles were confirmed to be AuNPs using hyperspectral imaging (data not shown) of AuNPs to provide reference spectra, which were then mapped onto the image and colocalized with the particles. In support of the hypothesis, penetration of the tissue with NPs is greater in the alveolar regions than in the terminal bronchiolar regions. Clearly, though, the NPs are not uniformly distributed in alveoli but are more heavily localized in the acinar region near the TB.

