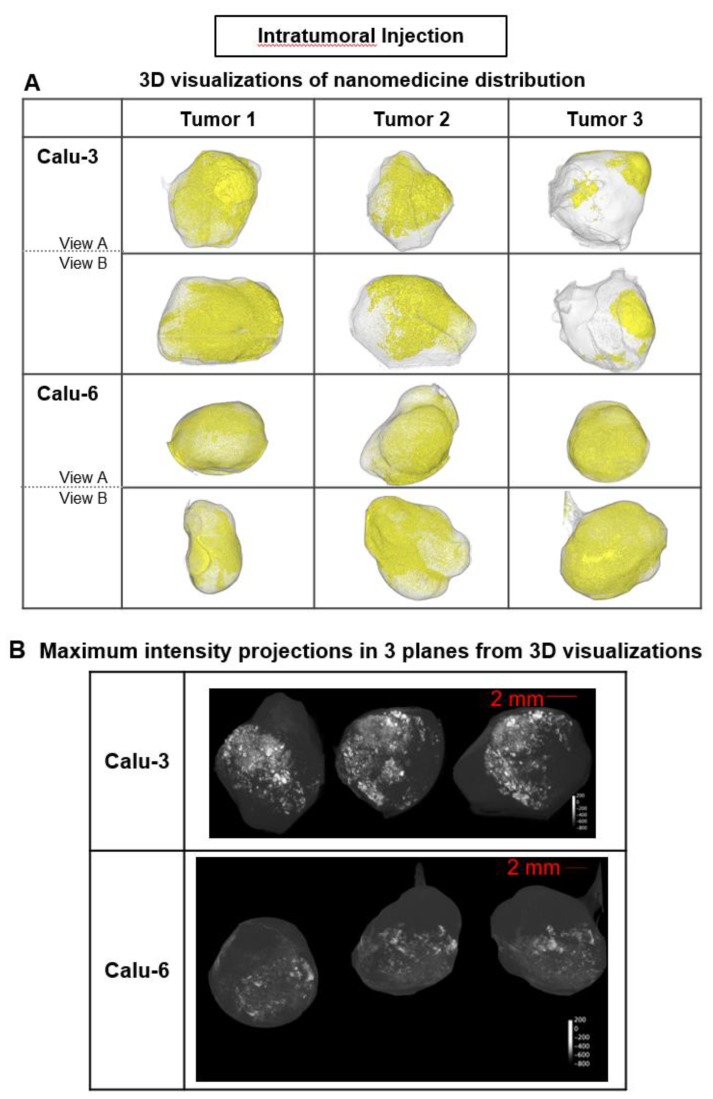
Figure 3.
Liposome accumulation and distribution in preclinical tumor models following intratumoral injection. A) Liposome distribution in 3D at 6 h post-ITu dose in Calu-3 and Calu-6 tumors. Two views of each tumor shown. B) Maximum intensity projections of liposome distribution in 1 dimension at 6 h post-ITu dose for the x- (left), y- (middle), and z-plane (right) in representative Calu-3 (left) and Calu-6 (right) tumors.

