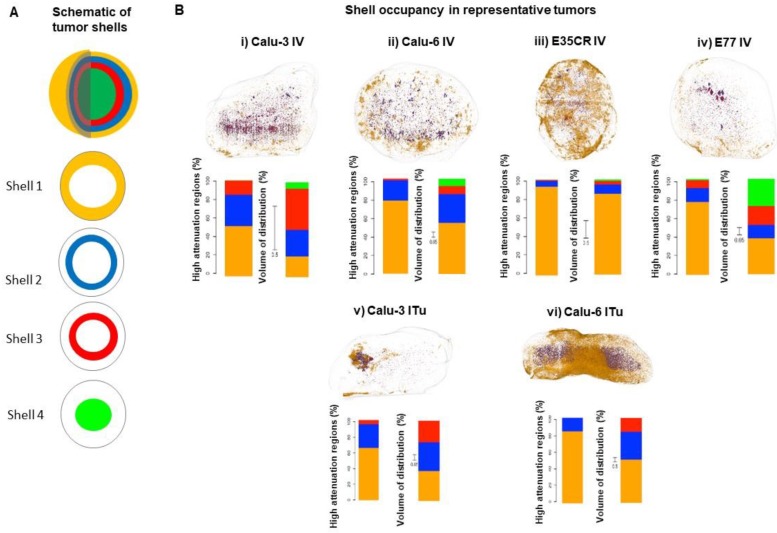
Figure 6.
A) Schematic of tumor shells. For analysis, tumors were divided into three shells of 1 mm thickness beginning at the tumor periphery and moving towards the core, and a fourth shell encompassing everything greater than 3 mm from the periphery. B, images) Representative tumors showing liposome distribution in 3D, color-coded by shell across different tumor models at 24 h following IV (i-iv) or ITu dosing (v-vi). B, graphs) Quantification of liposome distribution across shells for shown tumor (left bar) and percentage of each shell volume occupied by liposomes (right bar, note: non-uniform scale). IV dosing (i-iv) and ITu dosing (v-vi).

