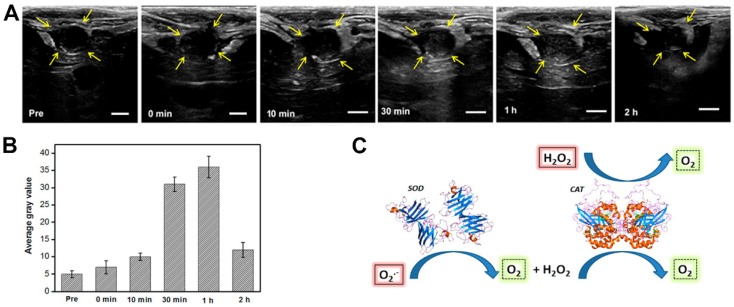
Figure 6.
In vivo US imaging. A US imaging and B the corresponding average gray values of VX2 tumors on rabbit livers before and after intravenous injection of SGC (SPIO@GCS/acryl/biotin-CAT/SOD-gel) at various times. C. Schematic mechanism of responsive bubble generation for US imaging. D. Yellow arrows indicate outlines of the VX2 tumors. The bars in A correspond to 0.5 cm. The standard deviation in B is derived from a group within the region of interest (ROI) (n = 3) 141.

