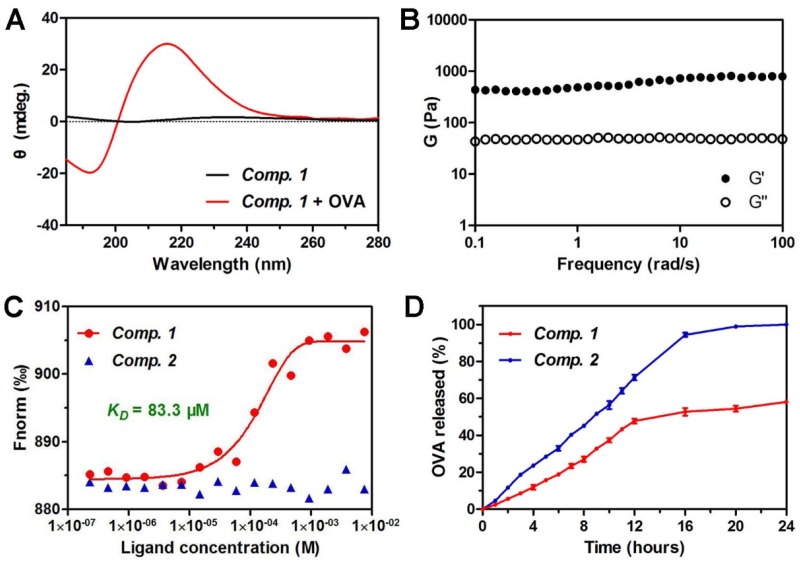
Figure 2.
Characterization of protein antigen-induced hydrogel vaccine. (A) Circular dichroism (CD) spectra of hydrogels containing 0.5 wt% of Comp. 1 and 0.05 wt% OVA. (B) Dynamic frequency sweep of hydrogel of Comp. 1 containing 10 % amounts of OVA at strain of 0.1% at 37 oC. (C) The fitting curve of microscale thermophoresis (MST) to calculate the KD values between Comp. 1 or Comp. 2and OVA. (D) The profiles of OVA release from Comp. 1 and Comp. 2 at pH 7.4 at 37 oC.

