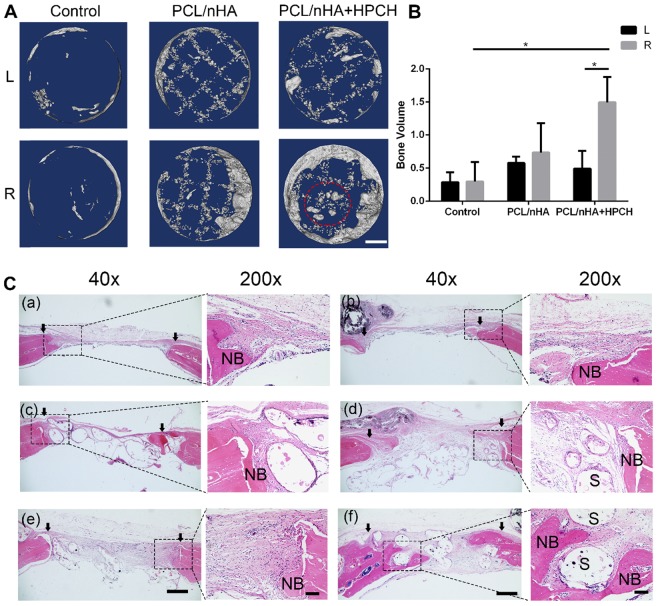
Figure 8.
Micro-CT and H&E histologic evaluation of in vivo calvarial defect repair at 9 weeks of post-implantation. (A) The representative micro-CT images of the control, PCL/nHA, PCL/nHA+HPCH group in the left and right defect. Red dotted circle indicates spheroid bone formation in the central of scaffold. (B) Quantitative result of bone volume in different groups. * represents p<0.05. Scale bar, 1mm. (C) The representative whole and local photomicrographs of HE staining images of calvarial defects at 9 weeks of post-surgery. The newly formed bone in control group (a-b), PCL/nHA group (c-d), PCL/nHA+HPCH group (e-f), where (a), (c), (e) were the left defect and (b), (d), (f) were the right defect. 200X image in each group was the magnification of newly formed bone either in margin or in central of the defect. NB, new bone; S, scaffold. The arrows indicate the boundary of bone defect and native bone. Scale bar: 500 μm in 40X, and 100 μm in 200X.

