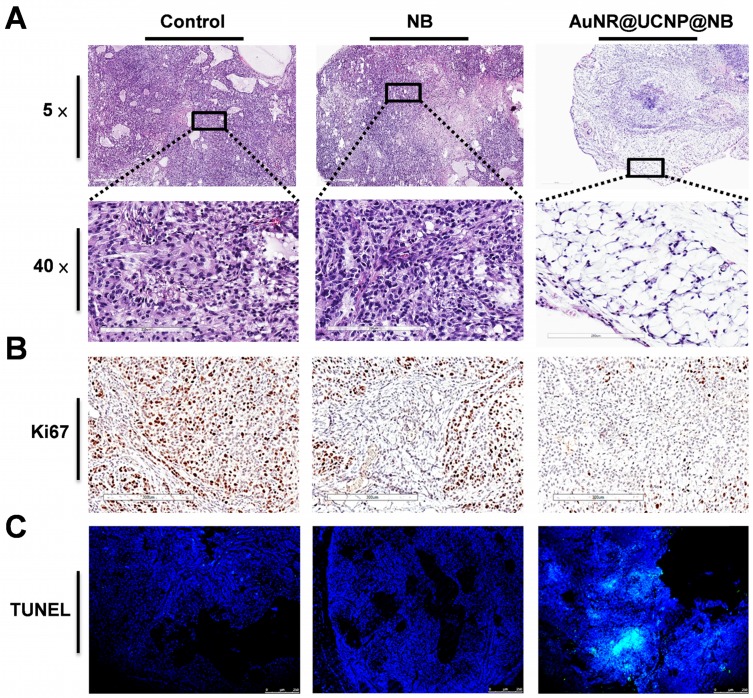
Figure 10.
A549 tumor tissue staining. (A) 5× and 40× H&E, (B) immunohistochemistry, and (C) TUNEL tissue staining to present the change among the “Control,” “NB” only, and “AuNR@UCNP@NB” groups. The Ki67 stain reveals the brown spots overlapping with the cell nucleus. TUNEL-FITC is overlapped with DAPI as observed by LSCM.

