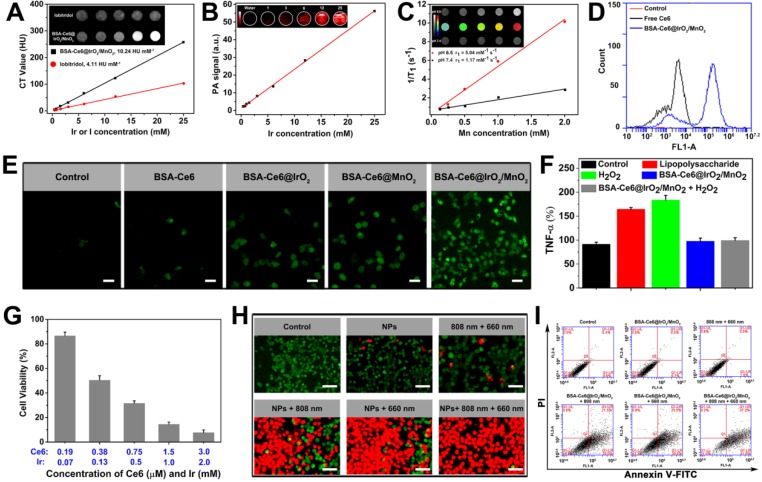
Figure 4.
Imaging and cytotoxicity data obtained with BSA-Ce6@IrO2/MnO2 dispersions. (A) In vitro CT images and mean HU values. (B) PA images and signals. (C) T1-weighted MR images and relaxivity fits of BSA-Ce6@IrO2/MnO2 dispersions at pH 5.0 and 7.4 in the presence of H2O2. (D) Flow cytometry data obtained on of MDA-MB-231 cells incubated with Ce6, BSA-Ce6, and BSA-Ce6@IrO2/MnO2 NPs. (E) Intracellular 1O2 production after MDA-MB-231 cells were incubated with different formulations under laser irradiation (Ir: 3 mM, Mn: 2 mM). Scale bars: 50 µm. (F) Intracellular TNF-α level in L929 cell treated with LPS or BSA-Ce6@IrO2/MnO2. (G) Relative viabilities of MDA-MB-231 cells after incubation with BSA-Ce6@IrO2/MnO2 NPs and exposure to an 808 nm laser (1.0 W cm-2, 10 min) and 660 nm light irradiation (5 mW cm-2, 30 min). (H) Calcein-AM/PI staining images of MDA-MB-231 cells after different treatments (scale bar = 100 μm). (I) Flow cytometry results for Annexin V-FITC and PI co-stained MDA-MB-231 cells after different treatments.

