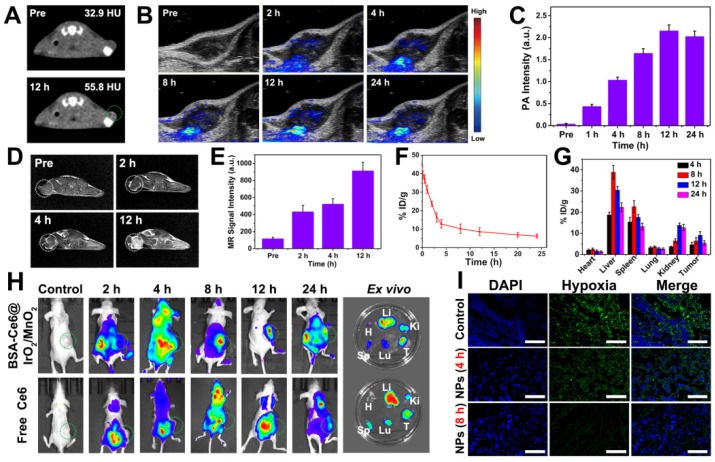
Figure 5.
In vivo imaging, biodistribution, and up-regulation of oxygenation data obtained on MDA-MB-231 tumor bearing mice after i.v. injection of BSA-Ce6@IrO2/MnO2. (A) CT images. (B) PA images. (C) PA signal intensity as a function of time. (D) In vivo T1-weighted MR images. (E) MR signal intensities at different time points. (F) Blood circulation data quantified in terms of Ir concentrations in the blood. (G) The distribution of the NPs as a function of time, quantified in terms of Ir concentration. (H) In vivo fluorescence images taken at different time points and ex vivo images 24 h post-injection (H, Li, Sp, Lu, Ki, T denote the heart, liver, spleen, lung, kidney, and tumor respectively). (I) Representative immunofluorescence images of tumor slices collected from mice after the different treatments.

