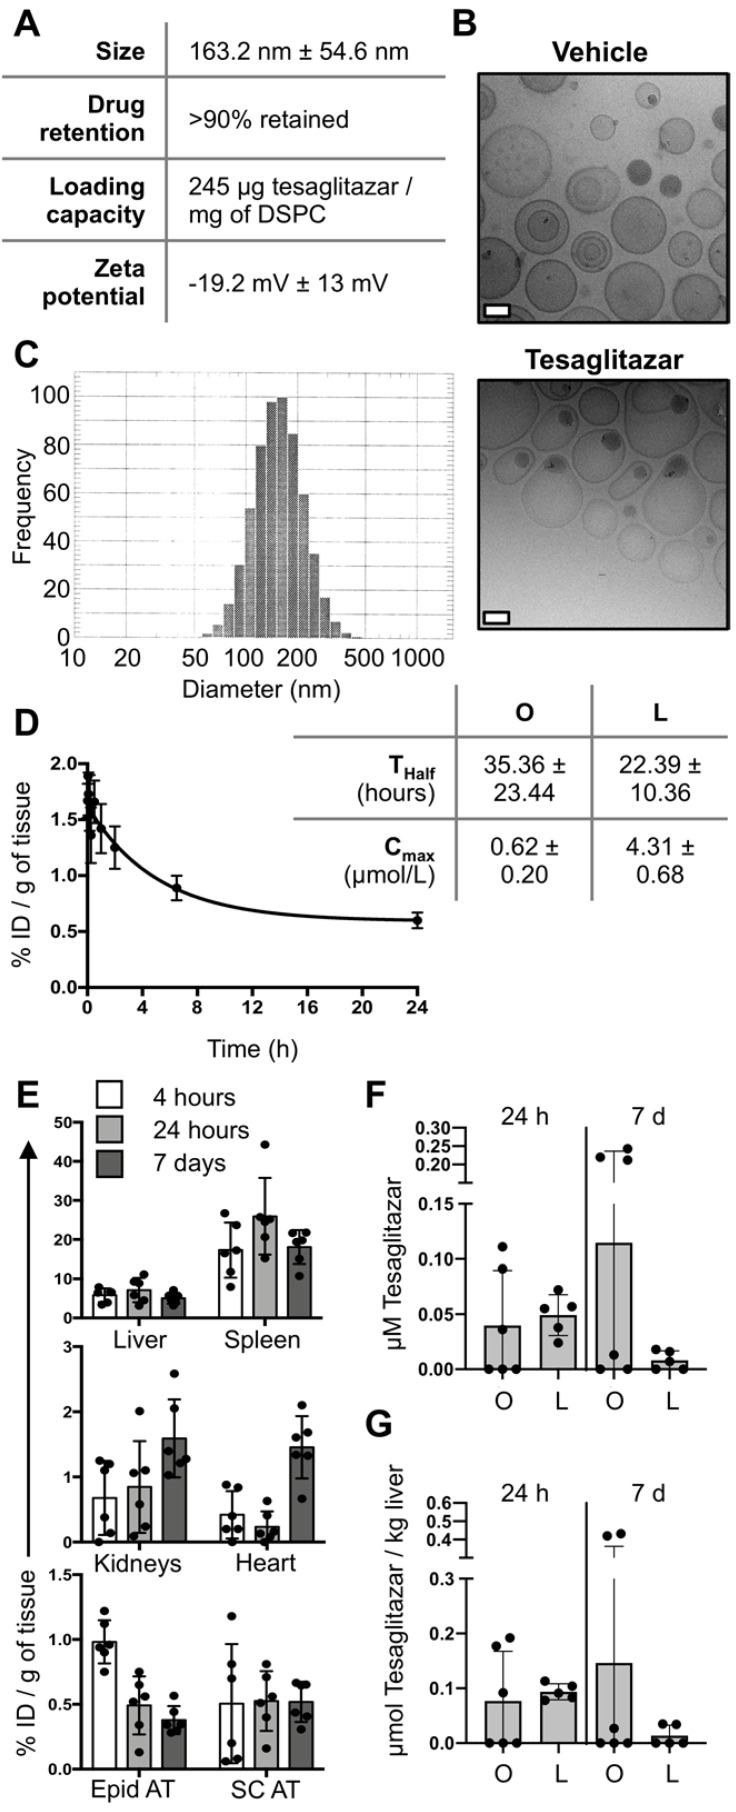
Figure 1.
Liposome synthesis and blood and tissue PK and biodistribution. (A) Liposomes were synthesized, labeled with DiD, and loaded with tesaglitazar. Data reporting liposome characteristics are listed. (B) CryoTEM images of vehicle- and tesaglitazar-loaded liposomes are displayed to provide examples of liposome shape. White scale bars represent 50 nm. (C) DLS was utilized to quantify liposome size. (D) Tesaglitazar was administered orally (O) and in DiD-labeled liposomes (L) and blood was harvested at multiple time points to calculate the half-life (Thalf) and C-max (Cmax) of drug in circulation using non-compartmental analysis. (E) FMT was used to quantify liposome uptake in liver, spleen, kidneys, heart, Epid and SC adipose tissues four and 24 hours following administration as well as after seven days with three administrations of liposomes. (F,G) LC-MS was utilized to quantify tesaglitazar levels in circulation (F) and in liver tissue (G) at 24-hour and 7-day time points post-treatment. Standard oral formulation (O) and liposomal (L) delivery methods were compared to verify comparable drug exposure levels. Data represents the mean ± SD.

