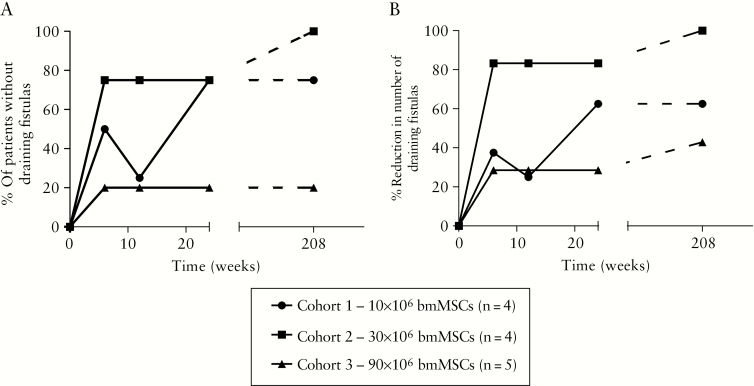
Figure 1.
Fistula closure after 4 years of follow-up. [A] Percentage of patients per group without draining fistulas at Weeks 6, 12, 24, and 208 after therapy. [B] Percentage of reduction in the number of draining fistulas per group at Weeks 6, 12, 24, and 208 after therapy. Only patients who were evaluated in the long-term follow-up were included in the graphs.

