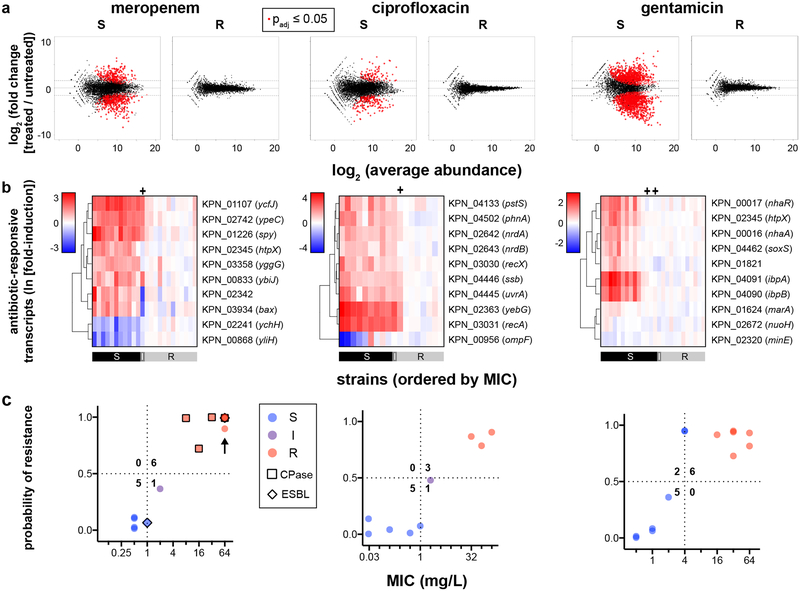
Fig. 1. Differential gene expression upon antibiotic exposure distinguishes susceptible and resistant strains.
(a) RNA-Seq data from two susceptible (left panels) or two resistant (right panels) clinical isolates of K. pneumoniae treated with meropenem (60 min), ciprofloxacin (30 min), or gentamicin (60 min) at CLSI breakpoint concentrations are presented as MA plots. Statistical significance was determined by a two-sided Wald test with the Benjamini-Hochberg correction for multiple hypothesis testing, using the DESeq2 package28. (b) Heatmaps of normalized, log-transformed fold-induction of top 10 antibiotic-responsive transcripts from K. pneumoniae treated at CLSI breakpoint concentrations with meropenem (left, 24 independent clinical isolates), ciprofloxacin (center, 18 independent clinical isolates), or gentamicin (right, 26 independent clinical isolates). Gene identifiers are listed at right, along with gene names if available. CLSI classifications of each strain based on broth microdilution are shown below. + = strains with one-dilution errors in classification. (c) GoPhAST-R predictions of probability of resistance from a random forest model trained on NanoString data from the derivation cohort and tested on the validation cohort (y-axis) are compared with standard CLSI classification based on broth microdilution MIC (x-axis) for K. pneumoniae isolates treated with meropenem, ciprofloxacin, and gentamicin. Horizontal dashed lines indicate 50% probability of resistance. Vertical dashed lines indicate the CLSI breakpoint between susceptible and not susceptible (i.e. intermediate/resistant). Numbers in each quadrant indicate concordant and discordant classifications between GoPhAST-R and broth microdilution. Carbapenemase (square outline) and select ESBL (diamond outline) gene content as detected by GoPhAST-R are also displayed on the meropenem plot. Arrow indicates a strain with high-level meropenem resistance, but no carbapenemase.

