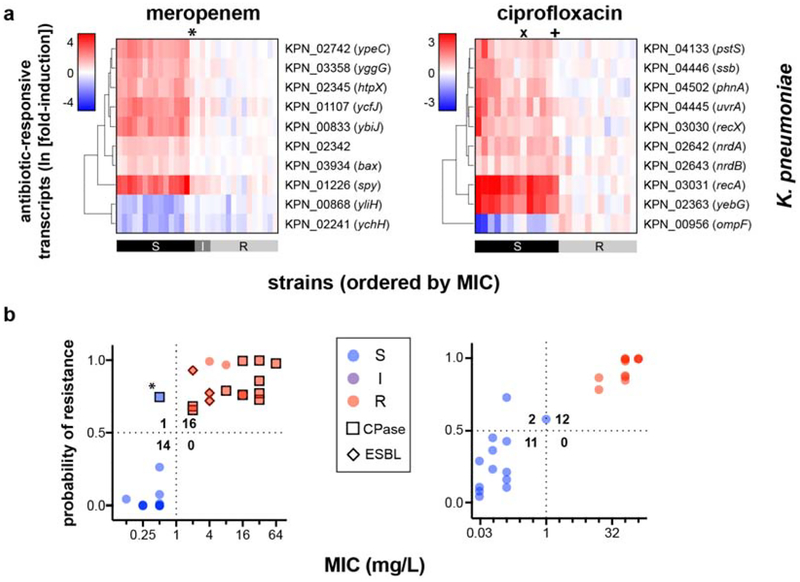
Extended Data Figure 8. GoPhAST-R accurately classifies K. pneumoniae isolates tested in phase 2.
(a) Heatmaps of normalized, log-transformed fold-induction of top 10 antibiotic-responsive transcripts from K. pneumoniae treated at CLSI breakpoint concentrations with meropenem (31 independent clinical isolates) or ciprofloxacin (25 independent clinical isolates). CLSI classifications are shown below. * = strain with large inoculum effects in meropenem MIC; + = one-dilution error; x = strain discordant by more than one dilution. Note that the 10 responsive transcripts shown are the only 10 tested for this second phase of GoPhAST-R implementation. (b) GoPhAST-R predictions of probability of resistance from a random forest model trained on all Phase 1 NanoString data the independent Phase 2 cohort (y-axis) compared with standard CLSI classification based on broth microdilution MIC (x-axis). Horizontal dashed lines indicate 50% probability of resistance. Vertical dashed lines indicate the CLSI breakpoint between susceptible and not susceptible (i.e. intermediate/resistant). Numbers in each quadrant indicate concordant and discordant classifications between GoPhAST-R and broth microdilution. * = strain with large inoculum effects in meropenem MIC.

