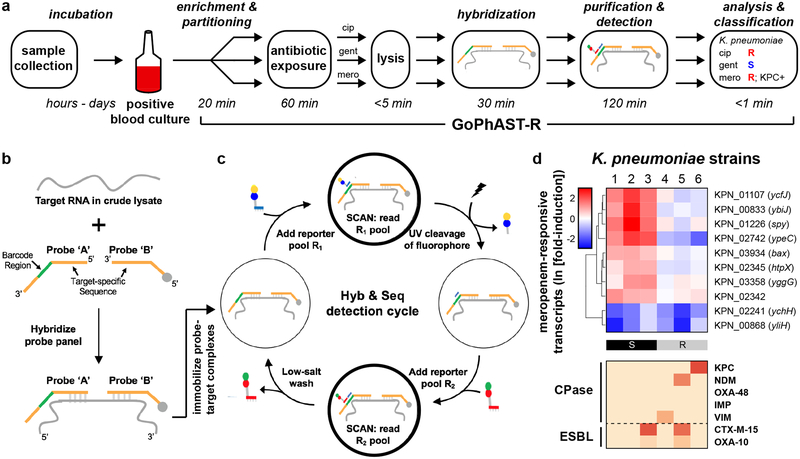
Fig. 4. GoPhAST-R workflow with the NanoString Hyb & Seq™ platform distinguishes phenotypically susceptible from resistant strains and detects genetic resistance determinants in <4 hours.
(a) The GoPhAST-R workflow on the Hyb & Seq detection platform begins once growth is detected in a blood culture bottle. Pathogen identification could either be done prior to this process, or in parallel by multiplexing mRNA targets from multiple organisms (see Supplementary Text). (b) Hyb & Seq hybridization scheme: probe pairs targeting each RNA transcript are hybridized in crude lysate. Each probe A contains a unique barcode sequence (green) for detection and a shared 3’ capture sequence; each probe B contains a biotin group (gray circle) for surface immobilization and a shared 5’ capture sequence. (c) Hyb & Seq detection strategy: immobilized, purified ternary probe-target complexes undergo sequential cycles of multi-step imaging for spatially resolved single-molecule detection. Each cycle consists of reporter probe binding and detection, UV cleavage, a second round of reporter probe binding and detection, and a low-salt wash to regenerate the unbound probe-target complex. 5 Hyb & Seq cycles were used to generate the data shown. See Supplemental Methods for details. (d) Pilot studies for accelerated meropenem susceptibility testing of 6 clinical K. pneumoniae isolates. Above: heatmaps of normalized, log-transformed fold-induction of top 10 meropenem-responsive transcripts measured using this Hyb & Seq workflow, with strains arranged in order of MIC for each antibiotic. CLSI classifications are shown below. Below: heatmaps of normalized, background-subtracted, log-transformed NanoString data from carbapenemase (“CPase”) and select ESBL transcripts measured in the same Hyb & Seq assay.

